You want to talk about following trends? Is there anything worse out there than Japanese Yen?
There is something important to keep in mind here: Consolidations tend to resolve themselves in the direction of the underlying trend. It’s not always the case (what is?), but more often than not, when an asset is trending: triangles, rectangles, flags, pennants, you you name it, these consolidations tend to breakout in the same direction they came from.
Today we’re looking at the Dollar/Yen $USDJPY. After a monster move from last Fall, the currency cross has been consolidating those gains in a text book range since the May highs. With lower highs and higher lows, we can see that the correction has taken the shape of a triangle made up of converging trendlines. Eventually, as prices approach the apex, something’s gotta give. I’m looking at 100.60 as confirmation of a new leg higher:
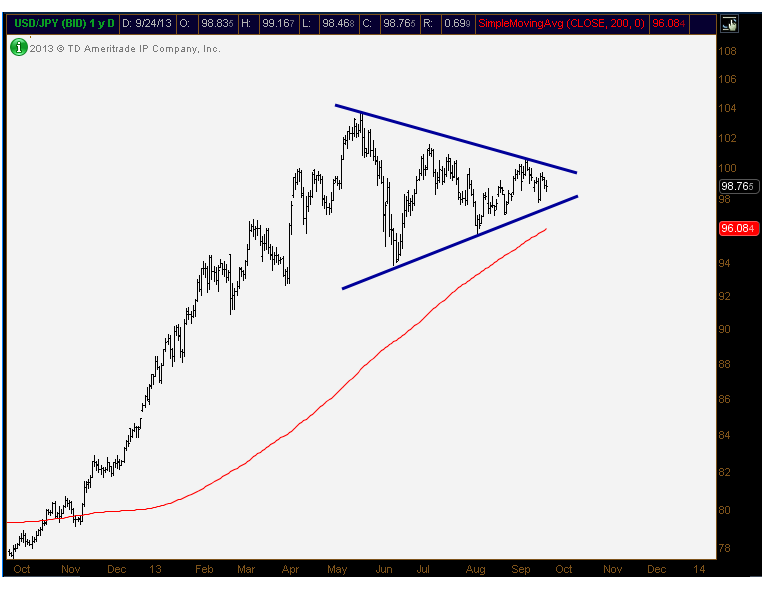
If Yen breaks down (this chart breaks out higher), you’re looking at about a 10 point measured move. This target is achieved by taking the height of the consolidation (May highs to June lows) and adding it to the breakout level mentioned above 100.60. So we’re looking for prices to get above 110.
There is a very strong negative correlation between Japanese stocks and their currency. If you look at $DXJ, the Wisdomtree Japan Hedged Equity Fund, prices have already broken out of a similar looking triangular consolidation. And it looks like it’s heading higher, which is not good for Yen.
I think we could be looking at a new leg lower for Yen. We’ll be keeping a close eye on this chart above.
Tags: $DXJ $FXY $USDJPY $EWJ $NK_F