Awesome
Source:
Expert technical analysis of financial markets by JC Parets
Audio: Ralph Acampora on Lack of Public Participation, 17-min mark (FinancialSense)
Ryan Detrick: Big Drop in AAII Bulls Could Bode Well for Stocks (Schaeffer’s)
Is It a Tech Bubble?…No…Just too Many Wantrepreneurs (HowardLindzon)
Silver Looks to Be Creating Another Eiffel Tower Pattern (KimbleCharting)
Why is Barron’s More Bullish Online Than in Print? (ReformedBroker)
Major Bottom in Precious Metals Could Occur This Week (Minyanville)
What was $JPM Trading That Cost Them $2 Billion (Felix Salmon)
Russell2000 and Nasdaq Composite Are Just Toying With You (chessNwine)
$OAK CEO Howard Marks on Contrarianism (MarketFolly)
It’s Clear – Just Upside Down: Silver, Gold, China, Dollar, Euro (MarketAnthropology)
Chartology: $AAPL Eyeing Important Fibonacci Retracement? (AndrewNyquist)
European Industrial Production vs Their Stock Market Performance (Dr. Ed Yardeni)
Catching Up With the “Market Wizards”, Where Are They Now? (BrianLund)
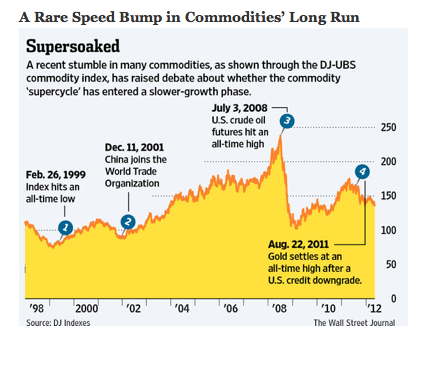
A Rare Speed Bump in Commodities’ Long Run (WSJ)
Tags: $GC_F $SI_F $GLD $SLV $SPY $IBM $COMPQ $RUT $IWM
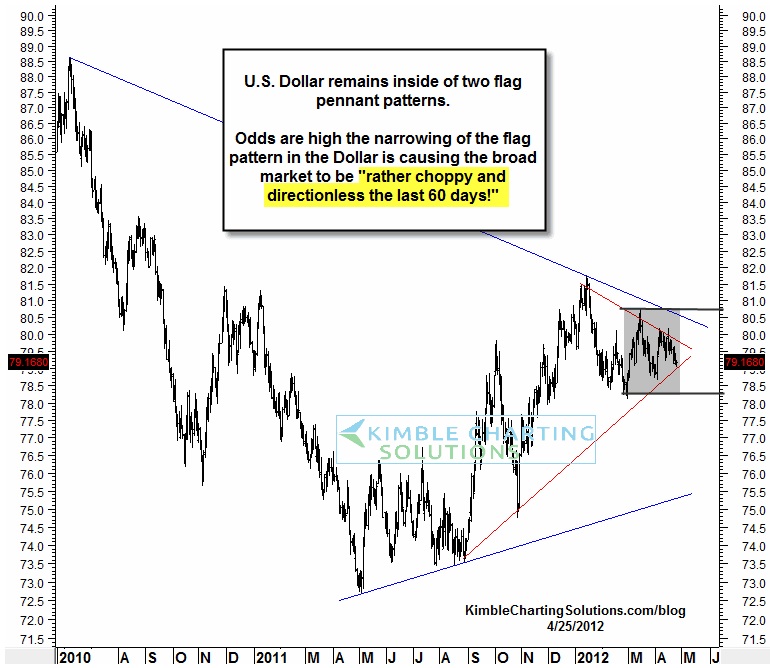
Today’s chart of the day is without a doubt Chris Kimble’s annotated US Dollar Index. The recent “choppy and directionless” action in the Dollar has clearly had an impact on the broad stock market. I would expect further consolidation in equities until the Dollar Index breaks out in one direction or another.
The chart below shows the US Dollar inside a typical pennant formation from Q4 ’11. This corrective pattern also falls within a much larger pennant that goes back to Summer of 2010. The current price is quickly approaching the apex of the near-term pattern so I would expect a resolution to come soon:
*Note – the US Dollar Index is up 9 days in a row going into today.
Source:
US Dollar Back at Resistance That Has Turned It Lower Since 2010 (Chris Kimble)
Tags: $UUP $USDX
*This post was originally published on Mothers Day May 8, 2011. The Dow went up 45 points the next day, Monday May 9th. This is typical for the day after Mothers Day. Enjoy!
***
Today is a Day we remember and thank Mom for everything she’s done for us. I know I was quite the handful growing up. My Mom lives in Miami with the rest of my family and I’m up in New York City trying to take over the world. She gets it, but it’s a little tougher on days like today. That’s where Skype and Facetime on the iPhone come in handy.
 Back in Elementary school Mom used to make me get up early on the days of big exams to go over my notes and be extra prepared for the tests. Now I get up early on my own to look over my charts and futures markets to prepare for the trading day ahead. How about that Mom? Thanks for good habits.
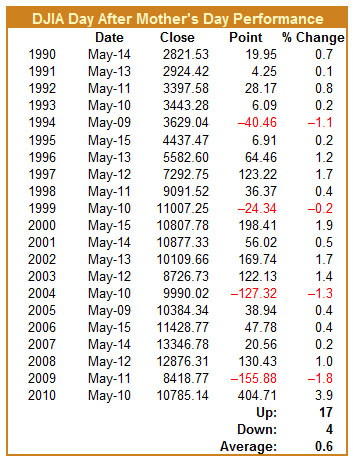
Perhaps I’m not the only one who is thankful. Mothers Day has also had a positive impact on the Market. If you take a look at some of the numbers, you’ll find that over the past 21 years the Dow Jones Industrial Average has advanced 81% of the time on the Monday after Mothers Day for an average gain of 0.6%. I understand that correlation does not imply causation but over the years the Monday after Mothers Day has fallen somewhere between the 9th and the 15th days of May. So there a bullish bias this time of year. Take it for what it’s worth. We’re not making trading decisions based solely on this information, but it’s interesting to note how positive traders act after spending the day with Mom.
Here are the numbers from the Stock Traders Almanac. Last year the Dow went up over 400 points the day after Mothers day. Keep in mind that it was a temporary recovery just after the flash crash, but 400 points is 400 points. I’ll be keeping en eye on the futures tonight before bed to see if history can repeat itself.
Happy Mothers Day to all the Moms out there. We wouldn’t be here without you!
Source:
Day after Mothers Day Historically Bullish (Stock Traders Almanac)
We had a blast visiting Harvard this week. I had never been to Cambridge before, campus was really nice. It was cool to meet some young kids interested in the markets and technical analysis. Truth is it was just an honor being there to share my charts and technical approach. The first Stocktwits Symposium at Harvard was definitely a success.
The boys and I took the train over to Boston on Tuesday morning so we could get some work done using the “free Wi-Fi” on Amtrak. It reminded me of the old AOL dial-up days because of how slow and inefficient it was. But I guess it got the job done.
First thing we did was head over to Harvard Square for Burgers at Bartley’s. This place was really hyped up so I went in with some pretty lofty expectations. And my delicious Newt Gingrich burger met them all. Or was it the Skip Gates that I had? 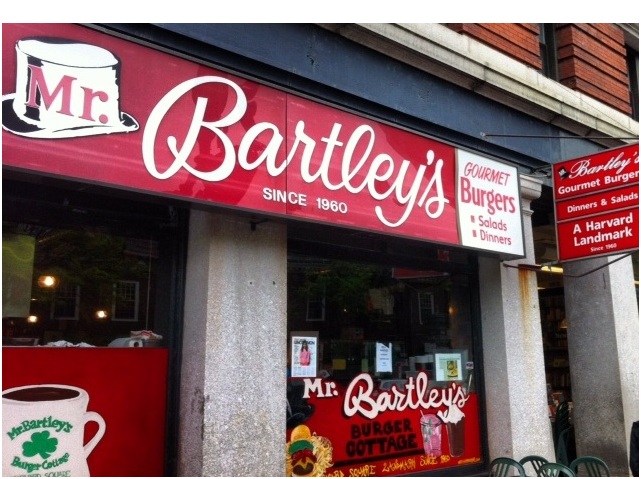 I forget, but it had pineapple, and cheddar, and was 100% delicious. The place said, “Best burgers in the USA”. And they just may have been.
So I put my suit on and walked into Harvard. What happened next was pretty funny. I was thirsty so ran down to the vending machine for a water bottle. I only had a $10 bill so I put it in to pay for my $1.50 beverage. Next thing I know I had a waterfall of dimes and nickels coming out of this machine like I just hit the jackpot at the Bellagio. I wish there was a camera filming this. I was looking around and no one saw it, no one to help, just me by myself depositing a lifetime supply of nickels into my not-so-big suit pockets. Needless to say, I was coined, “JC Bag of Nickels” for the rest of the evening.
Showtime
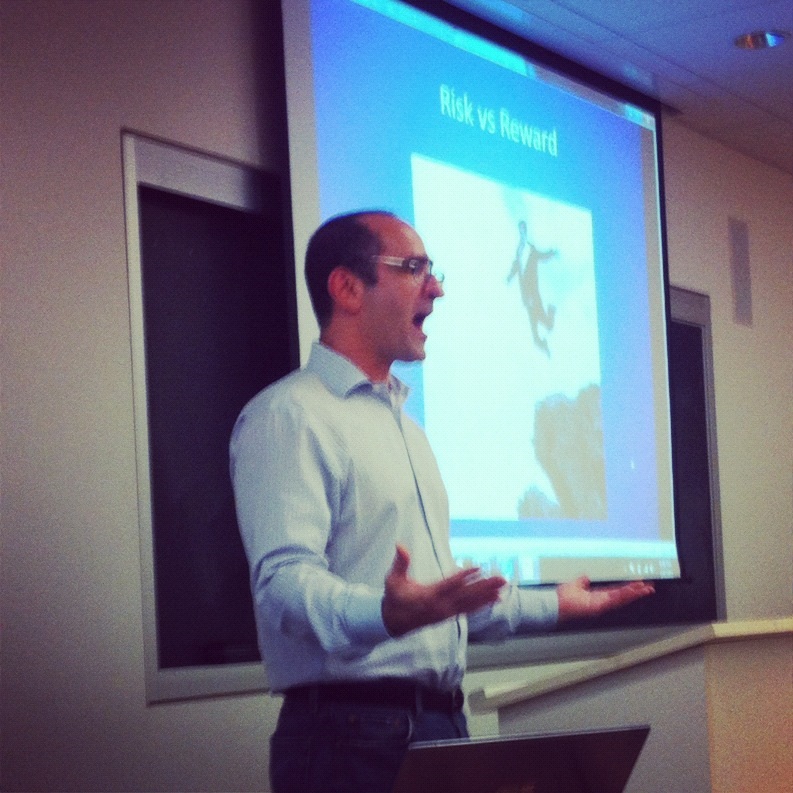 Phil Pearlman did his thing talking about Psychology, Trading and Social Media. Did you know that the blogging platform WordPress has been downloaded 65 Million times? Even the New York Times uses this tool. It really is amazing how far we’ve come from more traditional publishing. And to think that this revolution is just getting started…
Downtown Josh Brown managed to keep the F-bombs to a minimum, while still hilarious in getting some great points across. I learned during his presentation that 8.6 Million households in the United States have over a Million dollars in Financial Assets (in addition to home value). He brought up some interesting stats on baby boomers and raised some great questions about where we’re headed as food for thought.
Todd Sullivan showed us some of the ways he analyzes potential stock investments. His philosophies are night & day to mine so it was awesome for me to be there and learn. The last thing I want to do is listen to someone go up there who is saying exactly what I would have said. For me it was a treat to hear Sullivan explain how he finds undervalued companies. But more importantly, I was curious as to how he manages risk. His response was interesting. He essentially creates a road map as to how he expects the company to progress over the next year or so. If something unexpected occurs, or something that the company was suppose to do or come up with doesn’t happen or happens differently, then all bets may be off. I’ve always wondered how fundamental guys manage risk without studying price like we do. So that was cool.
And then it was my turn. Before getting going, I asked a few questions to the room full of students, staff, and market participants. The first question was whether we would see the S&P500 hit 1600 first or 1100. In other words, is the next 20% move going to be higher or lower? The results didn’t surprise me; it was literally 50/50 bulls and bears. So basically, no one has any idea where we’re headed. Not shocking.
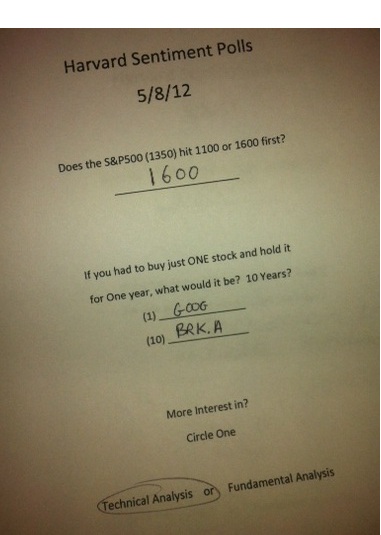 I asked what people were more interested in: Technical or Fundamental Analysis. Not what worked better, or what they’ve learned most about, but which one are you interested in more? Once again, the room was split right down the middle. Half the room was interested in technicals while the other half circled fundamentals. In this case, I was surprised to see so much interest in technical analysis. I was really impressed by that.
And just as a cool experiment, I asked, “If you had to buy just one stock and hold it for an entire year, what would it be? You can’t sell it for a whole year and you only get one”. Then I asked the same question, but this time you have to hold it for 10 years. There aren’t any right or wrong answers here, I just kind of wanted to see the thought process.
Not surprising, the stock chosen most was $AAPL, for both the 1 & 10 year scenario, representing about 10% of the responses. No other name was mentioned more than once for the 1 year example. For the 10 year, Berkshire A shares and Bank of America came in 2nd with the rest pretty diversified. Believe it or not, I only saw Facebook one time between both questions. Is this because none of the people polled thought it would be the best investment? Or because it isn’t public yet and no one really has a share price to go by? I don’t really know the answer to this one.
When Phil told me that I was going to be up there for 30-40 minutes, I really didn’t know what I was going to talk about. Phil said, “just put up your favorite charts”. I thought to myself, “I could be up there for hours. I’ve got charts for days“. But then I figured I would just talk about some of the different aspects of technical analysis. As I’ve mentioned here before, a lot of people simply don’t understand what technicians do.
I started out by asking the crowd what they thought technical analysis was. Some good answers came though like, Price & Volume. One gentleman felt that technical analysis was “backward-looking”. To his defense, he probably heard this one from someone else or read it somewhere. Chances are he probably hadn’t thought too much about how silly that sounded. Because of course it’s backward-looking. What isn’t? If we had information from the future, wouldn’t we spend all day looking at that? I know I would.
So I got the presentation going with some long-term charts: 120 year chart of the Dow Industrials, US 10-year yields since 1940, and my personal favorite historical Dow:Gold ratio. I told them that I thought it was important to understand where we’ve been to have any clue as to where we’re going. I was amazed at the amount of interest I got from the Dow:Gold ratio. Since it’s my favorite chart, I suppose that I take for granted how interesting the data is.
And then I just went into a discussion on Sector Rotation, Intermarket Analysis, Leading Indicators, Sentiment, Seasonality, and momentum. I got some really good feedback on the Momentum stuff. I talk about the Relative Strength Index (RSI) all the time and how I use it. But showing everyone a picture of the divergences, both bullish and bearish, I think went a long way.
The biggest thing I tried to get across was Risk Management. It almost doesn’t even matter how you get to the point of initiating your position. The most important thing is how much you’re willing to risk. Asking yourself the question, “where am I wrong”, is really the key. As Eli Radke put it, focusing on the Second Trade.
It was an honor to be there and I really had a lot of fun. I got to meet some great dudes from all over the country, cool kids still in College living the dream, as well as some professional market participants that I have a lot of respect for.
I’d do it again in a heartbeat. Great turn out, good crew, awesome food, and a bunch of us really learned a lot, which I think is the most important thing.
Thanks Stefan Cheplick for setting it all up. I hope you enjoyed it as much as we did.
Here is my slideshow in full:
Also See:
Back To School: My Presentation at Harvard (Reformed Broker)
Brief Overview of @Stocktwits Symposium at Harvard (Trader Habits)
Stocktiwts Symposium with Josh Brown, JC Parets, Todd Sullivan, and Phil Pearlman (Investingfreak)
Tags: $AAPL $BAC $BRK.A $FB
SFO Magazine: Current Pessimism Resembles Sentiment of Market Bottoms
Friday, May 11, 2012
By J.C. Parets
We see a level of pessimism out there from investors that we typically find at market bottoms, not at tops.
From Individual Investor Polls to NYSE short interest to bearish headlines in mainstream newspapers, there aren’t a lot of bulls in today’s stock market.
From a contrarian perspective, if you’re bullish, the last thing that you want to see is bullish individual investors, bullish mainstream newspapers and low levels of short interest. But guess what? With the S&P500 up 100% in three years, we’re still finding the opposite.
Short Interest on the NYSE has now risen to the highest levels for the year. According to Reuters, there were 13.1 billion shares short by the end of April compared to the 12.94 billion total as of April 13. For those looking for a catalyst to take this market higher, you may have one right here as shorts caught on the wrong side may have to quickly unwind this trade and buy shares back.
From a sentiment perspective, the most recent polls by the American Association of Individual Investors came in this week with even more pessimism. In fact, bearish sentiment rose to a seven-month high, while bullish sentiment fell to an eight-month low. Just 25% of individual investors polled felt bullish over the next 6 months. Neutral investors fell as well.
But most important, it was the spike in bearish sentiment that caught my attention. More than 42% of those polled expected stocks to fall in the next six months, compared with the 30% historical average.
INVEST IN STOCKS? FORGET ABOUT IT
This was the headline on Tuesday on the front page of the USA Today. Typically I would ignore something like this if it was more of a business or finance periodical. But in this case we’re talking about the USA Today.
Sources:
NYSE Short Interest Up 1.3% in Late April (Reuters)
A couple of months ago we were looking at some charts of the CRB Index (see here). One was a long-term picture showing key Fibonacci resistance while the other shorter-term chart showed us how the mid-290’s were critial support.
Well, here we are: this is now the third test of the 61.8% Fibonacci retracement. A breakdown here could potentially be devastating for commodities. The consequences of a support break would probably be another 15-16% down to the 2010 lows.
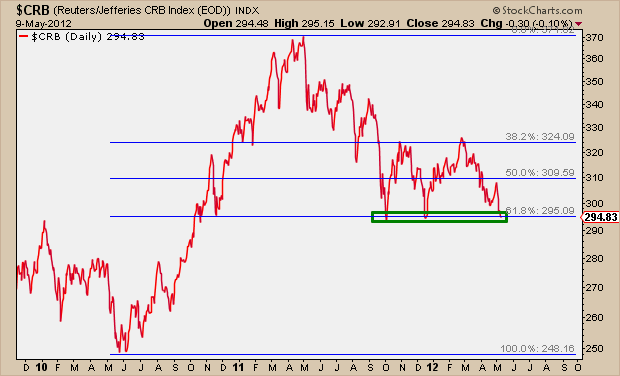
What worries me is that the more times a level is tested, the higher the likelihood that it breaks. We’re now going on 3.
The good news is that we still do not have a convincing support break and this could just be a nice buying opportunity as this level has served as a trampoline in the past. Momentum has been holding its own and maintaining its bullish mode, so far. And as we mentioned back in March, the recent overbought conditions were a good thing and the lack of oversold readings in the daily chart were also a positive.
Here is what Walter Kurtz had to say at Sober Look via Pragmatic Capitalism:
“The CRB commodity index has been a good relative indicator of global risk appetite. During stressed conditions the expectations for global growth declines, forcing commodities lower. Oil prices for example respond to the upside during periods of economic growth. But they also move up due to regional tensions such as those associated with Iran. The CRB index on the other hand tends to respond mostly to growth expectations only.
The index peaked in the first half of 2011, driven by QE2. In the past 9 months the index has found a support level at about 293. This is the third time during the period that we’ve approached this level, and it looks as though we are again going to bounce up. But it tells us that this period of financial stress driven by Europe and the US slowdown is similar to what we experienced in September and December of last year. This will be one of the key indicators to watch for early signs of financial stress conditions going forward.”
This is really the key level to watch. I don’t think there is any way around it. And as we’ve been saying, Energy is going to be important as it is the biggest component of the $CRB Index. (see Energy Needs To Step Up Here and Energy: All Eyes On Me). We can’t ignore this, regardless of what stocks or asset classes we’re trading.
There is wisdom in price.
Sources:
The CRB Index as a Stress Indicator (PragCap)
What Can We Learn From the CRB Index (Allstarcharts March 12, 2012)
So is it a head and shoulders pattern?
Yup.
The Russell 2000 Index of small-cap stocks was up 40% in just 6 months. By looking at this chart, the potential head and shoulders top formation is pretty obvious. The neckline is clear, left shoulder in February, head in March, and a right shoulder put in earlier this month. It’s obvious right? Josh and Phil were discussing it on the train back from Boston Wednesday and asked me about it.
Look at the 6-month chart of the iShares Russell 2000 ETF ($IWM):
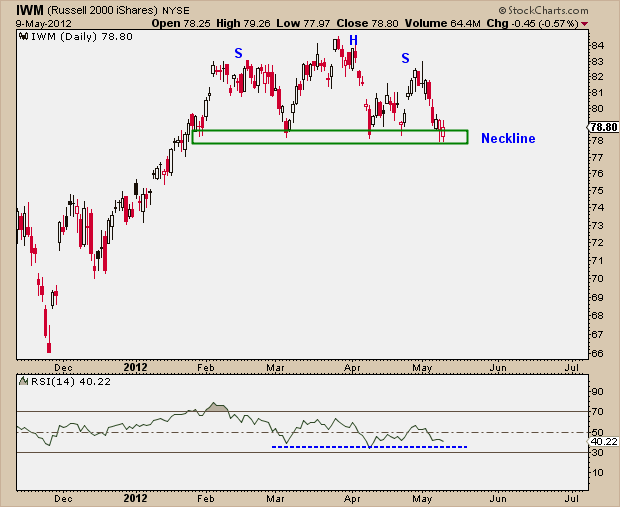
The small-cap index went up 150% in 3 years, 40% since October. So the trend here is up, no doubt about that. And since markets trend more often than not, finding turning points can be difficult. But we can’t ignore this classic topping formation. $78/share is my line in the sand. As usual, the market isn’t perfect and sometimes likes to tease by breaking down a couple of pennies below key trendlines before reversing. This was the case in $IWM the last couple of days getting down to 77.97 on Tuesday and Wednesday before reversing higher.
If this week’s lows get taken out then the price target for $IWM is about $72 ($78 minus 6 point range). But for now, I think we still have to give the bulls the benefit of the doubt. We were up almost the full 40% in just 4 months, then pretty much consolidated for 3 months in a sideways range. What’s wrong with that?
Also look at momentum: RSI is still in bullish mode. We haven’t seen any oversold conditions showing eveidence of mass selling. Quite the opposite in fact: the Russell has spend the last 3 months working off those overbought conditions from February without getting oversold (which would have been a bearish characteristic).
So is it a Head & Shoulders Pattern?
Yea. Sure. So what?
Is it a Head & Shoulders TOP?
Don’t know yet. Doesn’t look like it. But we’ll know soon if it is.
Tags: $TF_F $RUTX $RUT $TWM $UWM


