This is great stuff.
Sam Stovall over at S&P Capital IQ nails this one:
Visit msnbc.com for breaking news, world news, and news about the economy
$SPX $IEF $TNX
Source:
Expert technical analysis of financial markets by JC Parets
This is great stuff.
Sam Stovall over at S&P Capital IQ nails this one:
Visit msnbc.com for breaking news, world news, and news about the economy
$SPX $IEF $TNX
Source:
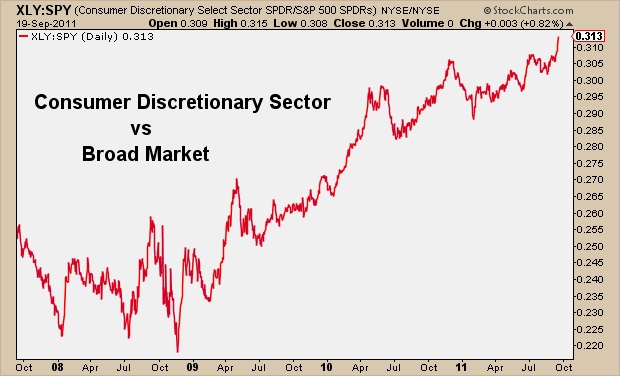
Yes, that’s right, the Consumer Discretionary Sector continues to outperform the rest of the market. I know I know, retail sales were flat in August, the unemployment rate is still above 9%, Euro Zone this, Greece that, debt levels, housing…blah blah blah.
You cannot argue with results. Period. The Wall Street Journal put out a nice piece this week about how the Consumer Discretionary Stocks are defying logic:
“In the face of weak employment data and even worse consumer sentiment, the Consumer Discretionary Select Sector SPDR Fund, the popular exchange-traded fund, is showing historic outperformance versus the Standard & Poor’s 500 index.
The fund is still down for 2011, and it’s come off midyear highs on an absolute basis, reflecting stock-market weakness and uncertainty over the U.S. economy. But if an investor plots its performance versus the broader market, the fund has proven a recent winner.”
It certainly has. Take a look at the performance of this fund ($XLY) vs the S&P500 ($SPY):
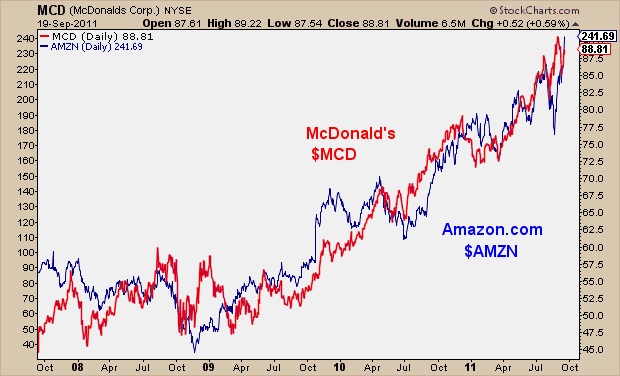
A few of the names that stand out in this particular group are McDonald’s ($MCD) and Amazon.com ($AMZN). According to State Street, these are the two largest components of the fund representing close to 15% of the entire ETF. Check out this performance on an absolute basis – both of these companies are sitting at or near all-time highs:
Ryan Detrick, Senior Technical Strategist at Schaeffer’s Investment Research said that,
“It all comes down to expectations….This group has quietly held up better, [even though] all we hear about are the various concerns about the consumer. We think it’s very encouraging that that’s been happening.…The overall economy is slowing, but it’s still growing, slowly….It’s one of those examples where [investor sentiment] is so very, very low.”
Everything is relative here. I thought the WSJ Blog did a nice job pointing out the out-performance of this sector in the face of a potentially weakening economy. Remember, this is the “Consumer Discretionary“ Fund, by definition where Consumers “Spend” their Discretionary Income…..something to think about…..something else to watch and/or trade….
Source:
Consumer-Discretionary Stocks Defy Consumer, Discretion, Stocks (WSJ)
Consumer Discretionary Select Sector SPDR Fund (XLY) Fact Sheet (StateStreet)
Oil and Stocks have been positively correlated this summer as the “Risk-On vs Risk-Off” trade continues. When money worldwide flows into more aggressive assets, for whatever the reason, Stocks and Oil benefit as Treasury Bonds and the US Dollar sell off. This chart shows $USO, the US Oil Fund, compared with $SPY, representing the S&P500. As goes oil, goes the stock market:
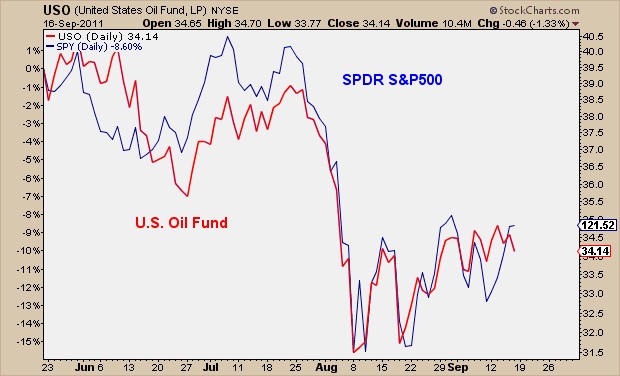
We can see this correlation clearly. So we’re going to take Stocks out of the equation here and focus just on $USO. The chart below takes us back to the 2009 bottom. We have been stuck in this range ever since the initial bounce that peaked that Fall. The 50% retracement of that move has held as support on a weekly closing basis. The 61.8% Fibonacci Retracement has been the absolute level of support where the reversal in early August first got going. To the upside, we can see the false breakout that occurred this spring when $USO tried to breakout above $42. From false moves, come fast moves in the opposite direction – and that is exactly what happened here. After the “breakout”, $USO has sold off hard.
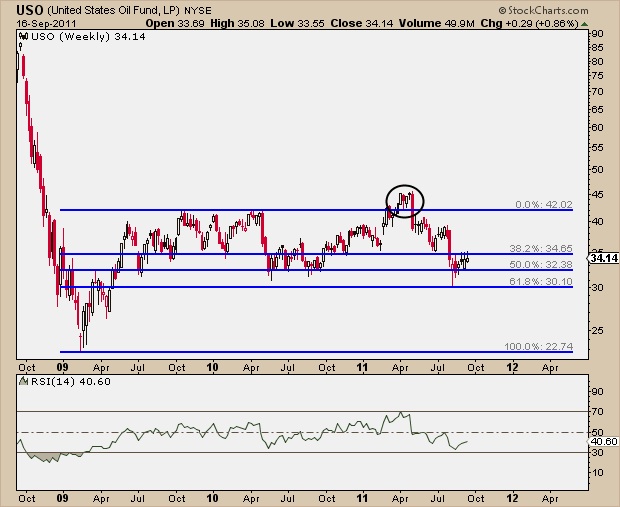
How much further does $USO have to go down? Has the bottom been put it? Looking a little bit closer here, $USO has formed what appears to be a classic rising wedge. If this indeed breaks down below the bottom trend line (confirming the wedge), then the down trend should continue. Look at the volume declining as the pattern has developed, classic.
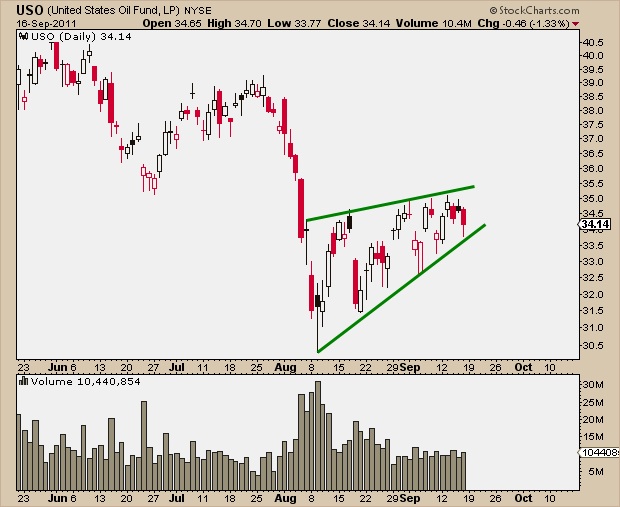
The June low near $35 was temporary support that has now been resistance throughout September. That level needs to be cleared in order to invalidate this potential rising wedge. The rally could take $USO up towards $39 and that would bode pretty well for the stock market. I’ll be watching $USO here for more clues about the market’s direction going forward.
It’s going to be a wild week. Fasten your seat belts.
We have been paying a lot of attention to the dollar lately. With this mess in Europe, how can we not? The Euro represents a majority of the overall US Dollar Index. So when the Euro rallies, the Dollar is likely to get hurt. When the Euro sells off, then the Dollar Index tends to rally.
Today we are looking at $UUP, which is the Powershares DB US Dollar Index Bullish Fund. The first chart shows the weekly performance of this Fund since it was originally created. Earlier this year, the fund made all-time lows and has been stuck below those key support levels ever since.
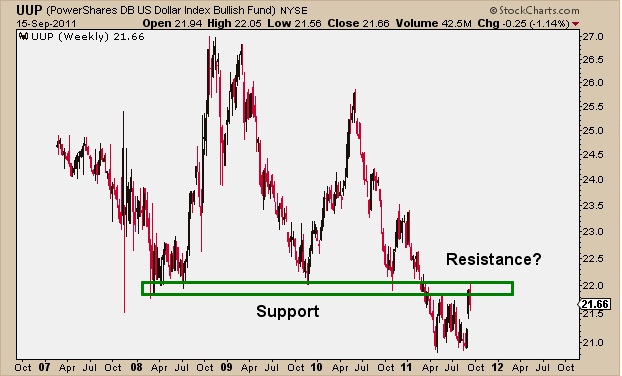
This former support has now turned into resistance. It certainly came into play this week after the Dollar tried to break out on this Euro weakness. Notice the rollover at the 200 day moving average in the chart below. The slope of that particular moving average is still down which makes it even more difficult for the Dollar to have a sustained breakout.
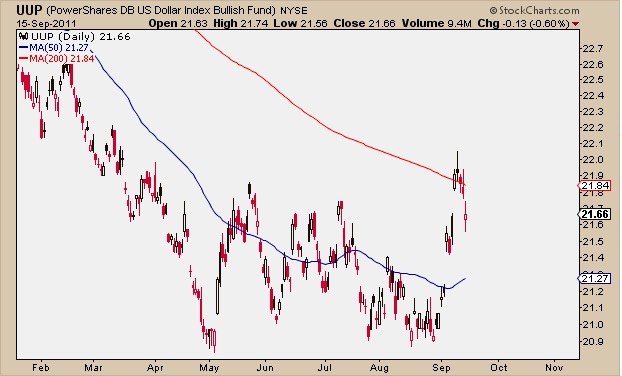
The Trend in the Dollar has been down for a long time. We have been talking about this for a while. It appears now that the Dollar has a lot of work to do if it wants to turn this thing around. I don’t see it. I still have to give the benefit of the doubt to the dollar bears. It sure looks like this is going to be an interesting Fall…..
(did you catch that?)
All Eyes on $QQQ today as the Nasdaq100 is the first of the major averages to retest it’s 200-Day Moving Average. In early August, all of widely followed indexes broke below their 200-Day’s and have been stuck below there ever since. For a stock or Index to be in a well defined uptrend, I want to see it trading above an upward sloping 200-Day Moving Average.
While the S&P500 ($SPX), Dow Jones Industrial Average ($DJIA), Russell2000 $RUT), NYSE Composite ($NYA) and Dow Jones Transportation averages ($TRAN) are all still well below their 200-Day’s, the Nasdaq100 is the first to attempt to recover it.
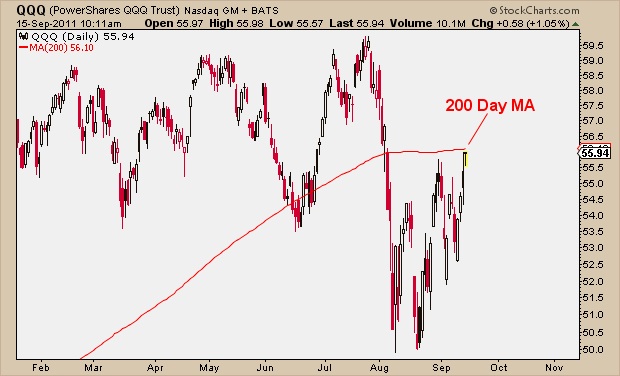
It’s almost like the rest of the Market Indexes are now watching how successful this attempt becomes as the others are likely to follow the leader. We also want to keep an eye on what the Semiconductors are doing ($SMH) as they typically lead the Nasdaq higher, or warn of weakness to come. After breaking below key support levels in August, the $32 level should turn into some resistance going forward.
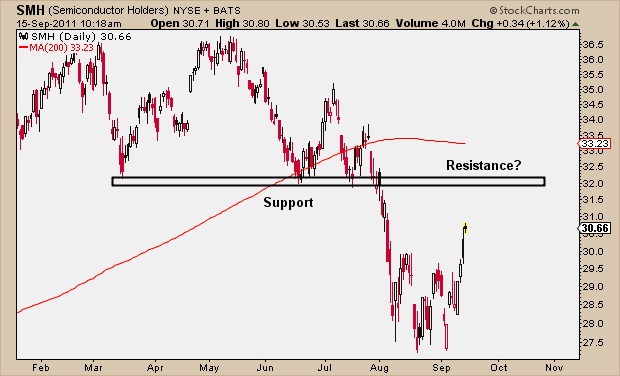
I can’t see a situation where the Nasdaq100 going on to make new highs into the $60s without participation out of the Semi’s. They both have some work to do.
I had to put this video up. Great stuff.
Barry Ritholtz chats with Jeff Macke on Yahoo Breakout:
Click on  for full screen.
Source:
Shares of $DELL are up a little this morning after last night’s announcement that they are repurchasing $5 Billion worth of Stock. In this age of innovation these guys really couldn’t think of anything better to do with their cash than buy back their garbage stock? Really?? Talk about putting good money after bad.
Look at this chart – the bottom of it shows the performance of $DELL shares relative to the S&P500 ($SPX). What a disaster this has been. Good market or bad market – $DELL consistently underperforms.
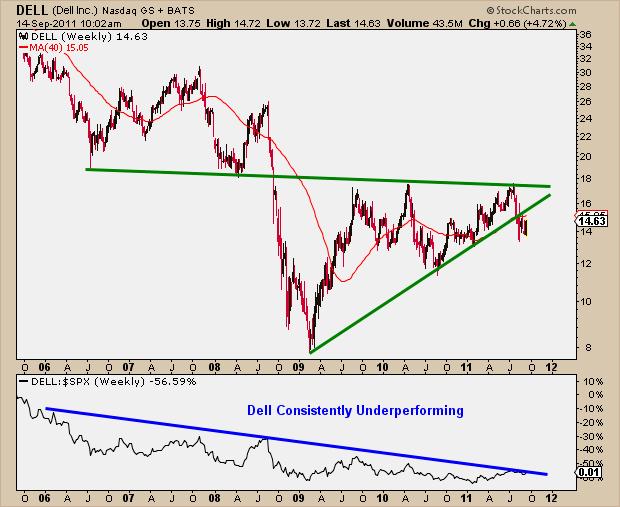
I see no reason to buy this stock, yet. The first thing we want to watch for is some sort of out-performance. If we see penetration above this declining trendline in the $DELL:$SPX ratio, then we’ll watch a little closer. The next thing that we want to see is the stock get back above this trendline that was broken on the price chart. Since the bottom in 2009, $DELL had been making higher lows and higher highs but recently broke below that trendline.
Looking out into the future, there is a defined level of resistance right around $17.50. Break through there and hold it and then come talk to me. Meanwhile, go check out what some of these analysts had to say this morning: $GS says to sell it, $UBS is somewhat indifferent, and Barclays and Merlin also had some comments. See the WSJ article for more.
Source:
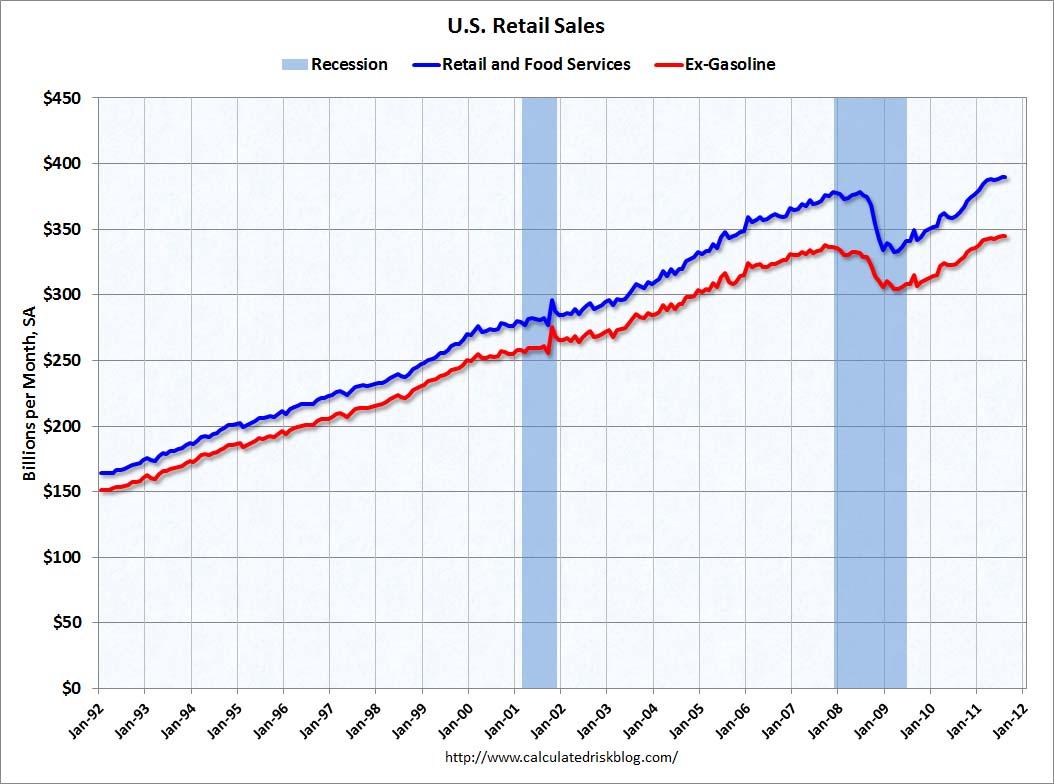
One of our must-watch leading indicators is the Monthly Retail Sales Index. The U.S. Census Bureau announced today that retail sales were flat from July to August but up 7.2% from August 2010.
Retail sales are now up 17.1% from the bottom, and 2.9% above the pre-recession peak.
Here is the chart via Calculated Risk:
Source:


