This is the video recording of our June 11, 2021 All Star Charts Crypto Weekly Strategy Session.
Divergence City + Bonds Break Out!
[Crypto] Waiting For A Resolution
No matter how many charts we analyze, the market ultimately gets the final word, not us.
We’re simply here to position ourselves where the risk vs. reward is exponentially in our favor. Unfortunately for trend-followers, there’s not a whole lot of opportunities floating around right now.
Until we get a move in either direction from this near-term range, longs are likely getting chopped up, and shorts probably aren’t working either.
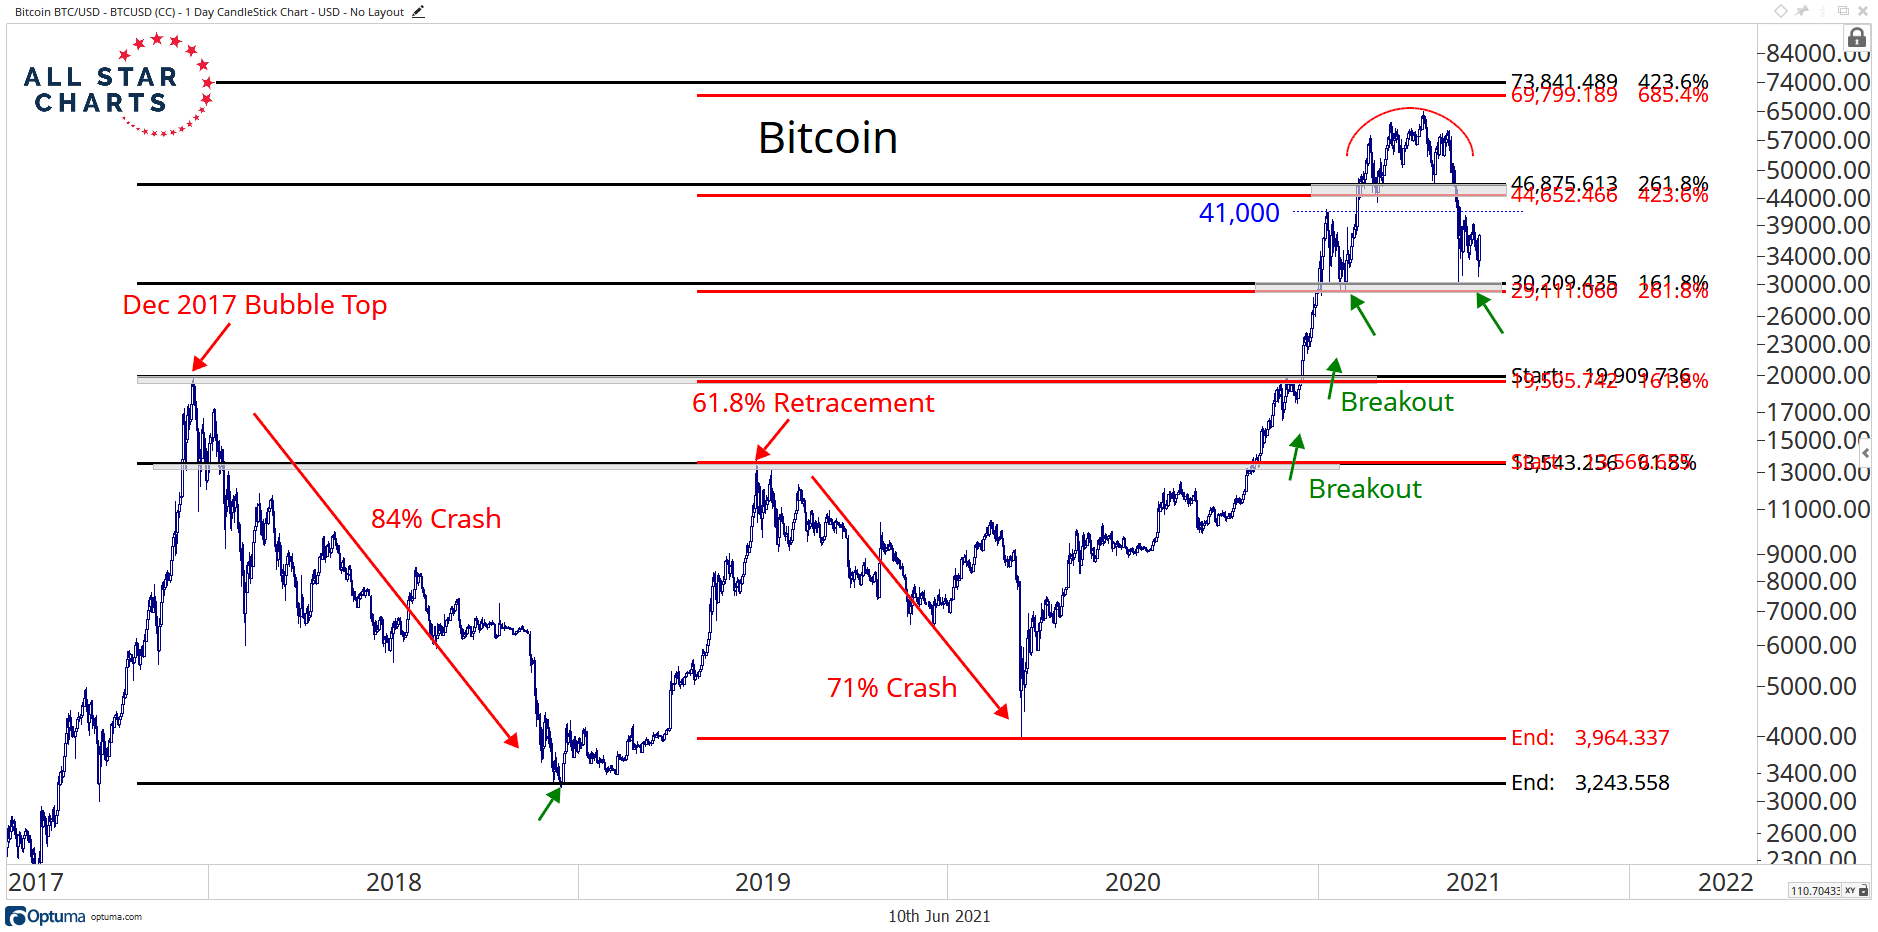
As we’ve mentioned repeatedly, 30k is the level to watch on the downside for Bitcoin, while 41,000 and eventually 48,000 is the upper level of this range.
Click on Charts to Zoom in
2 To 100 Club (06-10-2021)
From the desk of Steve Strazza @Sstrazza
Welcome to the 2 to 100 Club.
Something we’ve been working on internally is using various ‘bottoms-up’ tools and scans to complement our top-down approach.
One way we’re doing this is by identifying the strongest growth stocks as they climb the market-cap ladder from small, to mid, to large – and ultimately mega-cap status (over $200B).
Once they graduate from small-cap to mid-cap status (over $2B) they come on our radar. Likewise, when they surpass the roughly $30B mark, they roll off our list.
But the scan doesn’t just end there. We only want to look at the strongest growth industries in the market as that is typically where these potential 50-baggers come from.
Some of the best performers in recent decades – stocks like Priceline, Amazon, Netflix, and Salesforce, to a myriad of others… all would have been on this list at some point during their journey to becoming the market behemoths they are today.
When you look at the stocks in our table you will notice we are only focused on technology and growth industry groups such as Software, Semiconductors, Online Retail, Solar, etc.
Then like any good technician, we filter the list down to those that are closest to new 52-week highs. This allows the cream of these strongest groups to rise to the top and helps streamline our mission to identify technical breakouts in the top-performing stocks. [Read more…]
RPP Report: Review. Preview. Profit. (06-09-2021)
From the desk of Steve Strazza @sstrazza
Welcome to our latest RPP Report, where we publish return tables for a variety of different asset classes and categories along with commentary on each.
Looking at the past helps put the future into context. In this post, we review the absolute and relative trends at play and preview some of the things we’re watching to profit in the weeks and months ahead.
We consider this our weekly state of the union address as we break down and reiterate both our tactical and structural outlook on various asset classes and discuss the most important themes and developments currently playing out in markets all around the world.
While the weight of the evidence still remains in the bullish camp, bears seem to add to their list of talking points with every passing week of late. We believe the highest probability outcome over the coming weeks to months is for risk assets to remain in a mixed and messy environment. Once we begin to see evidence that indicates the current “chop fest” is nearing an end – which could simply come in the form of a reduction in the number of bearish data points, we think this party resumes in the direction of the primary trend… which remains aggressively higher in most risk assets.
But as the evidence becomes increasingly mixed, so does the way we want to approach the market and position ourselves to profit from the present environment. While we’re still buying plenty of stocks exhibiting leadership all around the globe… for the first time in over a year, we’re focused more on shorting the losers.
The latest incoming evidence has been overwhelmingly bearish and has continued to reinforce our cautionary outlook. Although, we have reason to believe this could finally be changing as risk assets made some real progress since our last RPP Report.
We still need to see some follow-through and confirmation of these developments, but over the past two weeks, we’ve seen more bullish data points than we have in months.
The ever-growing list of stocks and other risk assets consolidating at resistance has been a main theme we’ve hit on relentlessly of late. This had caused us to turn more and more cautious in recent months.
Well, much of the bullish information we’re seeing is from many of these holding patterns resolving higher from key levels of interest.
[Options] Looking for Profits to Drop in this Box
Seems there has been a lot of talk about the stock market “pausing” or being “due for a correction.”
While I see the same things the bears are seeing, I’m also seeing price action in a variety of corners of the market still telling a bullish story. And as we like to say around here: “Only Price Pays” (h/t @alphatrends).
We’re also seeing bullish options flow from several “motivated” and “aggressive” traders in a variety of names. Case in point: a software storage name in our most recent Follow the Flow report caught my attention.
Short The Crypto Stocks?
The thesis has been that if Bitcoin loses 30,000, we need to be aggressively shorting these digital assets.
In that environment, not only are Cryptocurrencies themselves likely getting slammed across the board, but crypto-related stocks are also going to come under pressure.
Unlike some other crypto and blockchain funds, the Amplify Data Sharing ETF $BLOK does a great job of finding stocks with direct or indirect ties to this still-niche industry.
Is USD Weakness About to Get REAL?
From the desk of Steve Strazza @Sstrazza and Ian Culley @Ianculley
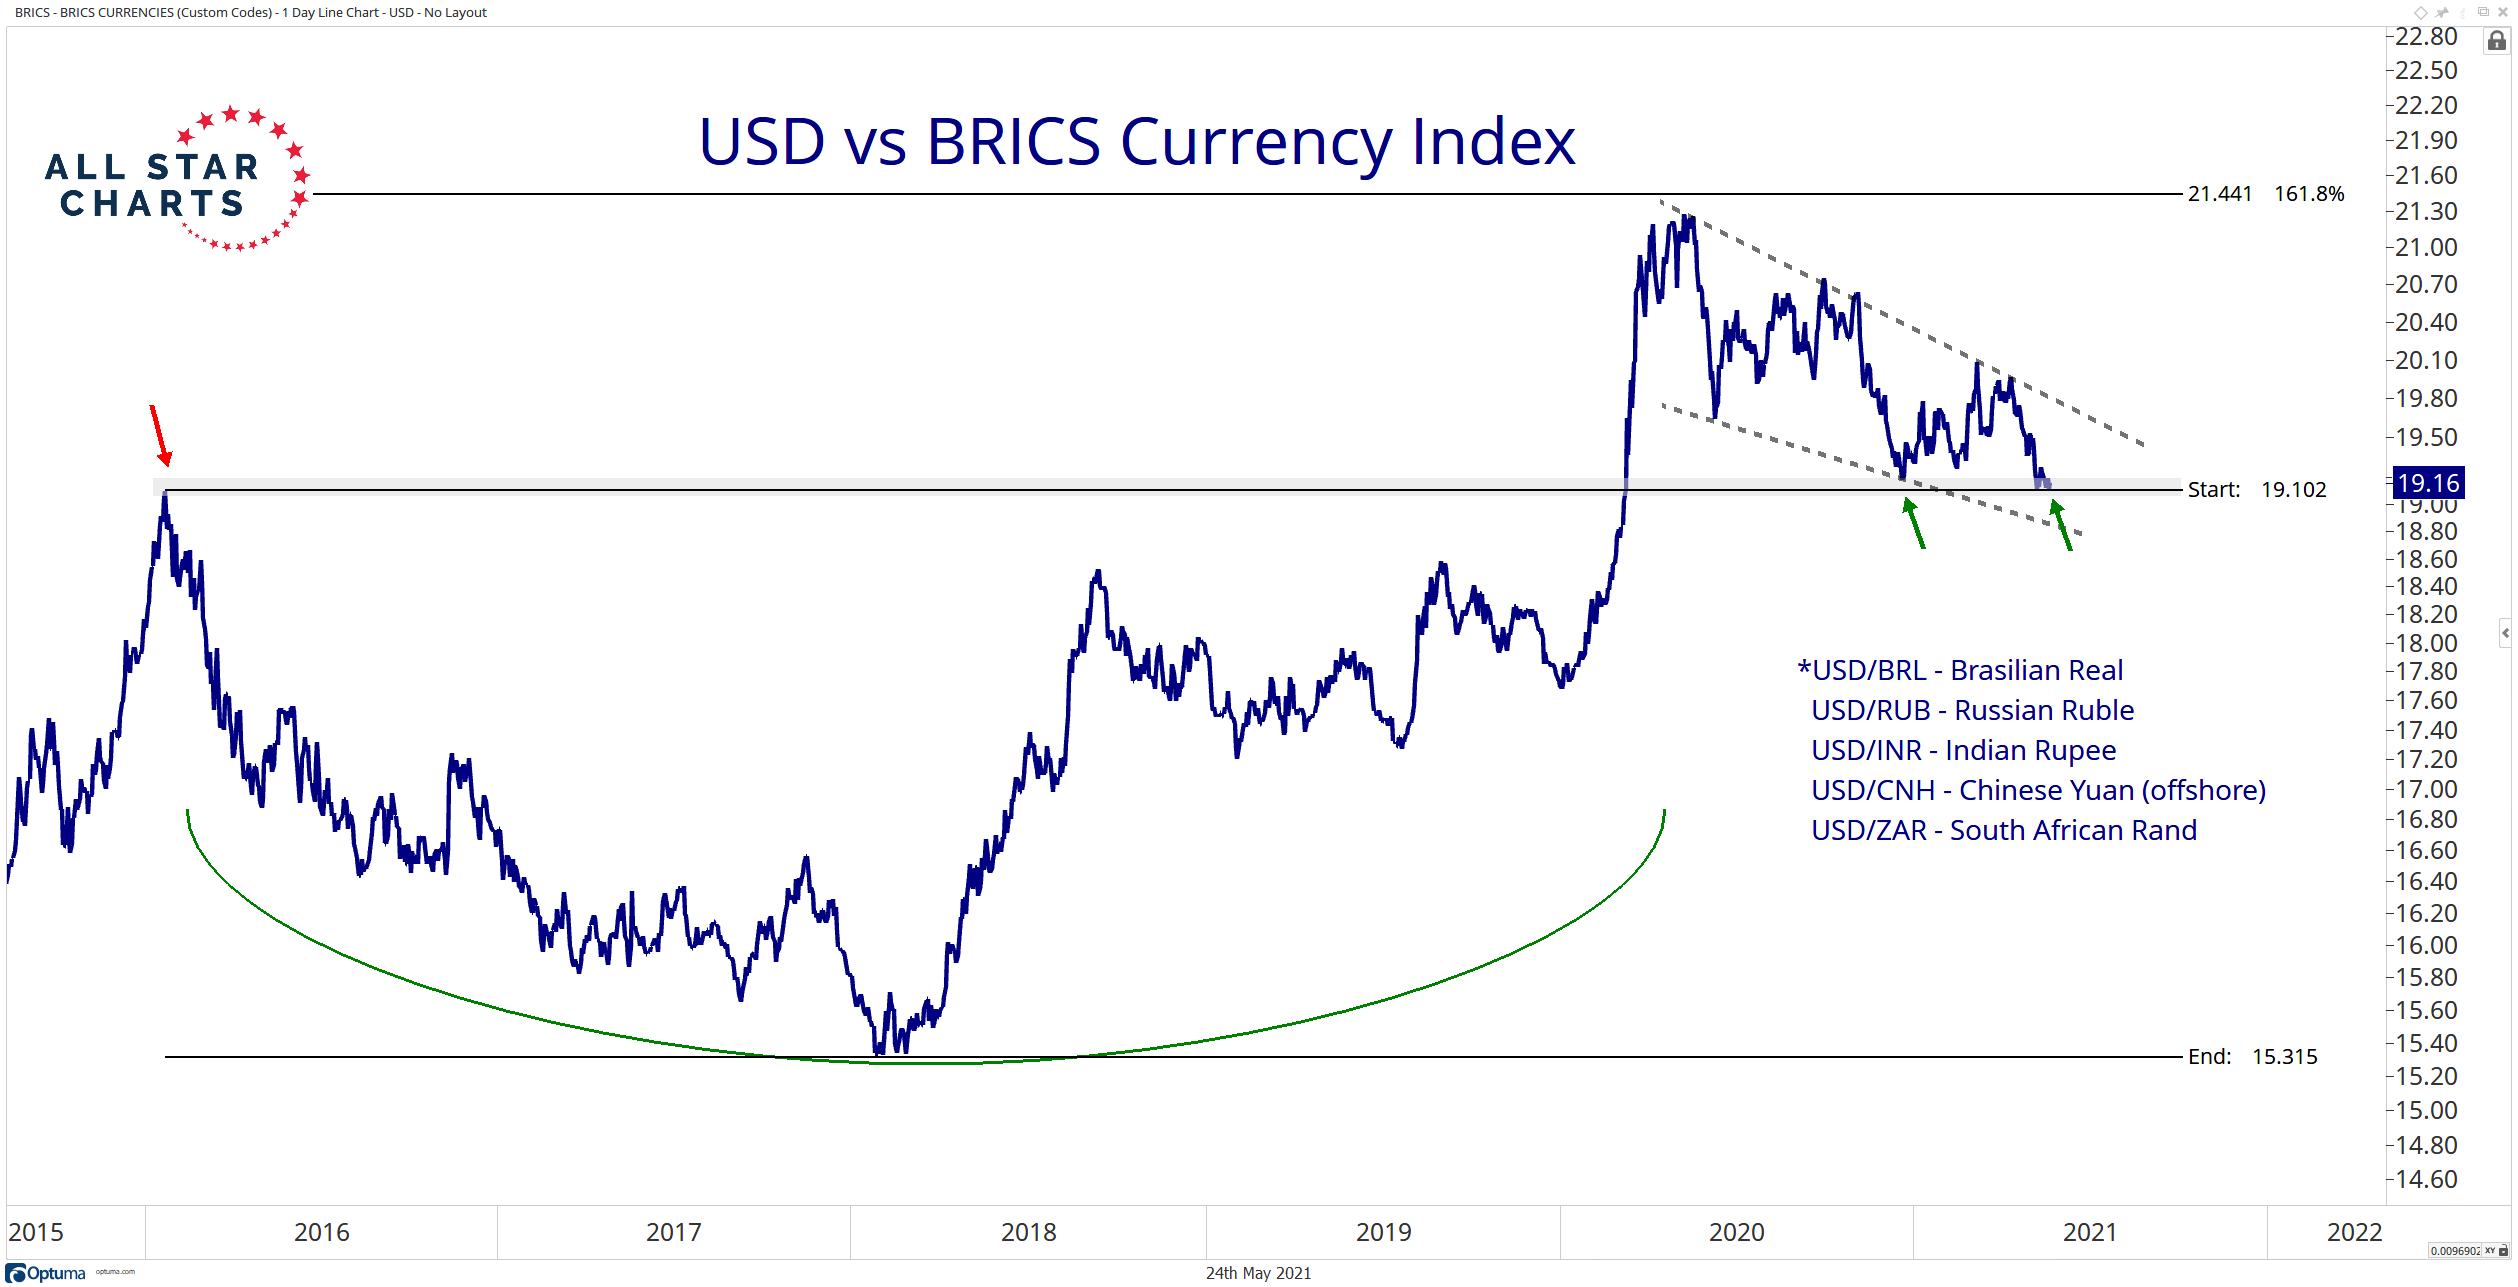
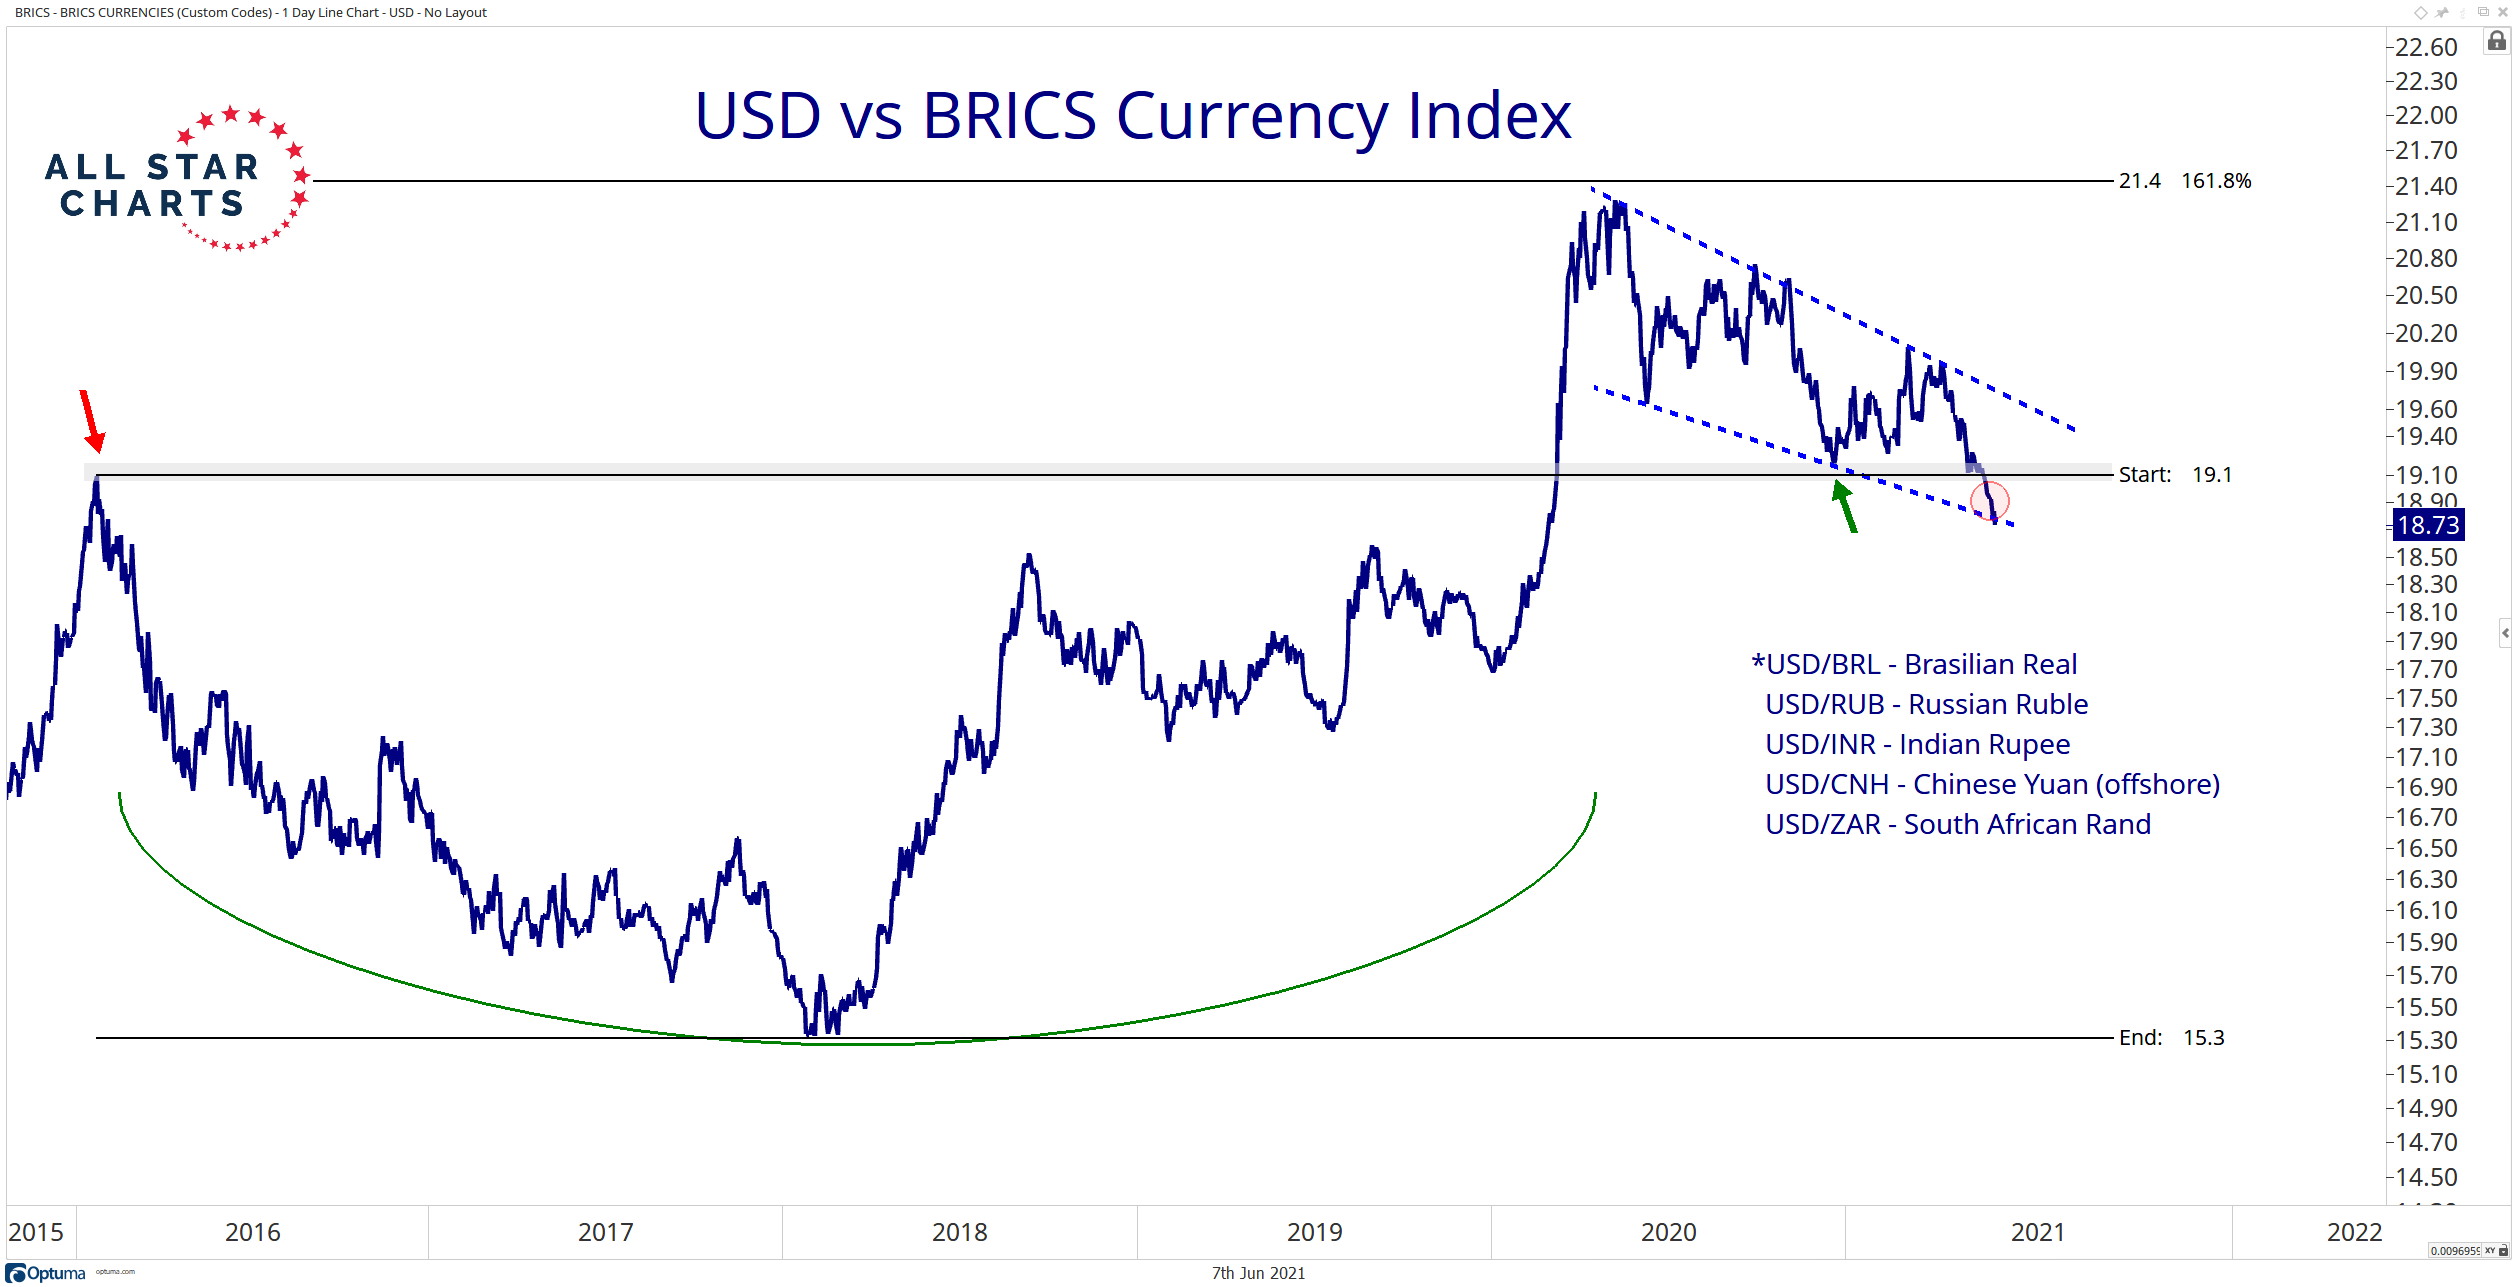
A couple of weeks ago, we posed this question in a post titled “Can the Dollar best the BRICS?”
Back then, we were already leaning toward “NO.” Fast forward to today, and it’s more like a “NO WAY.”
The reason for this is simple. In that post, we explained the line in the sand for our USD/BRICS Index was ~19.
In the few weeks since, this critical level has been violated. The market has spoken, and it’s saying we’re in for a lower US Dollar relative to BRIC-country currencies.
For you visual learners… This is what the chart looked like back then, and here is what it looks like now. Quite the difference, right?
This is just another data point in what’s become a rather long list of evidence pointing to broad US Dollar weakness over both short and long-term timeframes. We continue to see it everywhere.
Not only has the USD violated a critical level of former resistance turned support in our custom index, but it has also broken key levels of support against the Russian Ruble, Chinese Yuan, and the South African Rand – which are three of the five BRICS Currency Index components.
As many of the BRICS currencies are starting to show strength relative to the USD, let’s turn our attention to one of the holdouts, at least for now.
- « Previous Page
- 1
- …
- 467
- 468
- 469
- 470
- 471
- …
- 960
- Next Page »