This is the weekly post that aggregates all the charts we put together throughout the week and organizes them all into one, easy to flip through deck.

Expert technical analysis of financial markets by JC Parets
This is the weekly post that aggregates all the charts we put together throughout the week and organizes them all into one, easy to flip through deck.
From the desk of Steven Strazza @Sstrazza and Ian Culley @IanCulley
Procyclical commodities have attracted all the attention this year as inflation and rising rates have driven prices considerably higher.
But, as we pointed out last week, many of these contracts — Brent crude, natural gas, copper — are running into areas of overhead supply or are already in the process of correcting.
With that as our backdrop, let’s switch gears and focus on an area of the commodity space we haven’t talked about in months.
That’s right… precious metals!
While we’re seeing many leading commodities pause at logical levels of resistance, gold and silver have finally stopped going down and are rebounding off support. Despite trending lower since last summer, they’re still holding above the lower bounds of their trading ranges. We think this basket of shiny rocks is ripe for review.
Let’s take a look around the precious metals complex and see what’s new.
From the desk of Steve Strazza @Sstrazza
Our International Hall of Famers list is composed of the 50 largest US-listed international stocks, or ADRs.
These stocks range from some well-known mega-cap multinationals such as Toyota Motor and Royal Dutch Shell to some large-cap global disruptors such as Sea Ltd and Shopify.
It’s got all the big names and more–but only those that are based outside the US. You can find all the largest US stocks on our original Hall of Famers list.
The beauty of these scans is really in their simplicity.
We take the 50 largest names each week and then apply technical filters in a way that the strongest stocks with the most momentum rise to the top.
Let’s dive in and take a look at some of the most important stocks from around the world.
From the desk of Steven Strazza @Sstrazza and Grant Hawkridge @granthawkridge
While breadth has improved in recent weeks and months, the bulls still have their work cut out for them.
When we consider all our breadth indicators in aggregate, the evidence remains mixed. What else is new!? It’s been that way for the majority of this year.
Many of the major indexes made new all-time highs this week. Meanwhile, some advance-decline lines are moving higher, but others are moving lower. Some are at the top of their range, but others are at the bottom of theirs.
The advance-decline line measures stock market breadth based on cumulative net advances. In other words, it takes the number of advancing stocks on a given day and subtracts the number of declining stocks. That number is then added to the previous day’s value, creating a cumulative advance-decline line.
A/D line divergences occur when price is making new highs and the A/D line is NOT.
Just because there’s no divergence in the A/D line doesn’t mean the market can’t correct. We see this happen all the time. But when there is a divergence in the A/D line, we want to pay extra-close attention because there is a heightened possibility that price weakness will follow.
Let’s take a look at advance-decline lines for some of the major averages and indexes in the US equity market.
From the desk of Steven Strazza @Sstrazza and Ian Culley @IanCulley
Long-term interest rates have taken a hit this week, while the short end of the curve has continued higher. When we zoom out a bit, yields have been rising across the curve since this summer.
During the past few months, the 2-year yield has ticked higher by more than 30 basis points (bps), the 5-year has increased by almost 60 bps, and the 10-year has gained 40 bps. But when we look all the way out to the 30-year, it’s only risen by roughly 20 basis points.
Rates are rallying across the board, Treasuries are trending lower, and bond market investors are favoring TIPS and higher-yielding securities.
How do we want to position ourselves in this kind of environment?
Well, we definitely don’t want to be buying Treasury bonds.
In today’s post, we’re going to take a trip around the fixed-income market and discuss some US Treasury funds we can use as vehicles to express our thesis. [Read more…]
From the desk of Steven Strazza @Sstrazza
*** Click here to read the reveal post for this Mystery Chart ***
Check out our latest Mystery Chart!
What we do here is take a chart that’s captured our attention, and remove the x and y-axes as well as any other labels that could help identify it.
This chart can be of any security, in any asset class, on any timeframe. Sometimes it’s an absolute price chart, other times it’s on a relative basis.
It might be a ratio, a custom index, or maybe the price is inverted. It could be all three!
The point is, when we aren’t able to recognize what’s in front of us, we put aside any biases we may have and scrutinize the price behavior objectively.
While you can try to guess the chart, the point is to make a decision…
So, let us know what it is… Buy, Sell, or Do Nothing?
From the desk of Willie Delwiche.
Key Takeaway: There are plenty of adages to remind us that evidence of optimism re-emerging as stocks rally is neither surprising nor necessarily harmful to the health of the rally. When optimism gets overly excessive and begins to retreat we need to pay more attention to the risk side of the equation. What really caught our attention this week was that the imbalance in sentiment expressed by advisory services (Investors Intelligence) and individual investors (AAII) has been resolved. In mid-September, the AAII survey showed 22% bulls and 39% bears while the II survey had 50% bulls and 22% bears. Both surveys now show bulls in the 40’s and bears in the 20’s. Our sentiment chart of the week shows that when we’ve seen this degree of agreement between these surveys in the past, stocks have tended to do pretty well.
Sentiment Report Chart of the Week: Stocks Appreciate Survey Agreement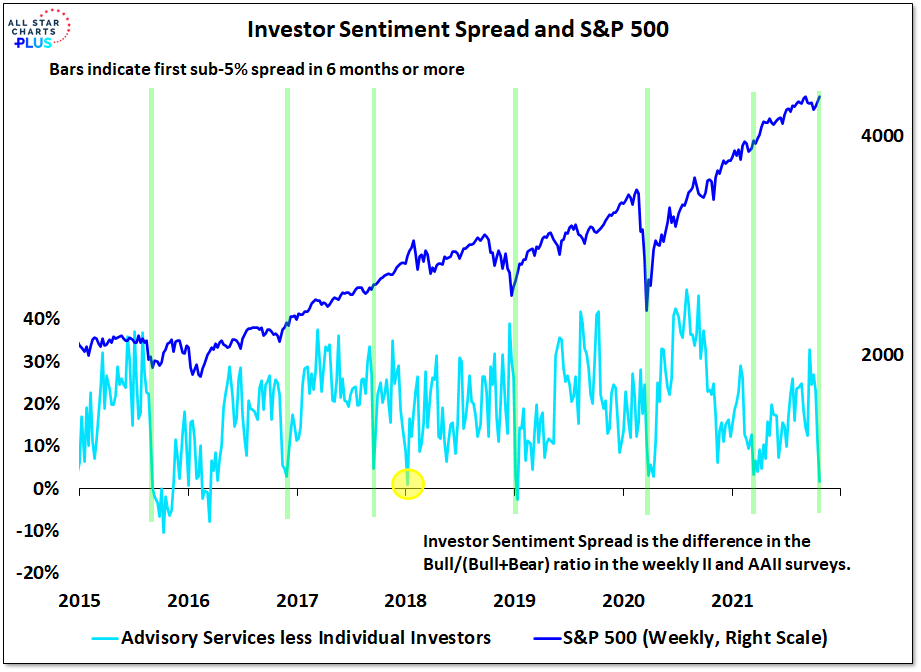
It happened in March of this year, it’s happening again – the II and AAII surveys are in agreement when it comes to bulls versus bears. When the surveys have shown such agreement in recent years stocks have tended to rally. In the wake of such sentiment spread narrowing since 2015, the S&P 500 has seen 26-week and 52-week returns that have been twice as strong as average. In the six months after the signal in March of this year, the S&P 500 was up over 13%.
Feels good to be back from vacation! And I’m glad to see the stock market fared nicely while I was gone.
Looking around, we’re seeing lots of fresh setups. But with earnings calls on deck, I’ll have to be patient with many of my favorite ideas to let the event pass so as not to caught offsides by a sudden move in the wrong direction.
However, one of my favorite setups just got its latest earnings release out of the way this morning and thankfully it basically amounted to a non-event. Its recent breakaway gap continues to hold above its prior 3-year resistance level. And with the binary earnings event out of the way, options premiums have been evaporating throughout the day. This sets us up for taking a longer-term position at advantageous prices. [Read more…]


