It’s been a while since we’ve had some bearish setups to tackle. My bearish muscles are out of practice!
But the ASC team during the most recent Monthly Charts Session pointed out some bearish developments in the Nasdaq 100.
Expert technical analysis of financial markets by JC Parets
It’s been a while since we’ve had some bearish setups to tackle. My bearish muscles are out of practice!
But the ASC team during the most recent Monthly Charts Session pointed out some bearish developments in the Nasdaq 100.
From the desk of Steven Strazza @Sstrazza and Grant Hawkridge @granthawkridge
Check out our latest Mystery Chart!
What we do here is take a chart that’s captured our attention and remove the x and y-axes as well as any other labels that could help identify it.
This chart can be of any security, in any asset class, on any timeframe. Sometimes it’s an absolute price chart, other times it’s on a relative basis.
It might be a ratio, a custom index, or maybe the price is inverted. It could be all three!
The point is, when we aren’t able to recognize what’s in front of us, we put aside any biases we may have and scrutinize it objectively.
While you can try to guess the chart, the point is to make a decision…
So let us know what it is… Buy, Sell, or Do Nothing?
From the desk of Willie Delwiche.
Key takeaway: Evidence of excessive optimism abounds. Recent articles in the Wall Street Journal provide anecdotes for the data: Conservative German savers are increasing their exposure to stocks and investors in the US are crowding into the market, focusing more on chasing returns than managing risks. Cyclical views trend and strategic positioning point to elevated risks but stocks have been buoyed by a favorable news backdrop (positive economic data surprises and upward earnings revisions) and resilient breadth. If these falter and investor appetite for risk fades, those areas of the market where speculative fever has burned the hottest could be the most vulnerable.
Sentiment Report Chart of the Week: Long Equity Camp Crowded
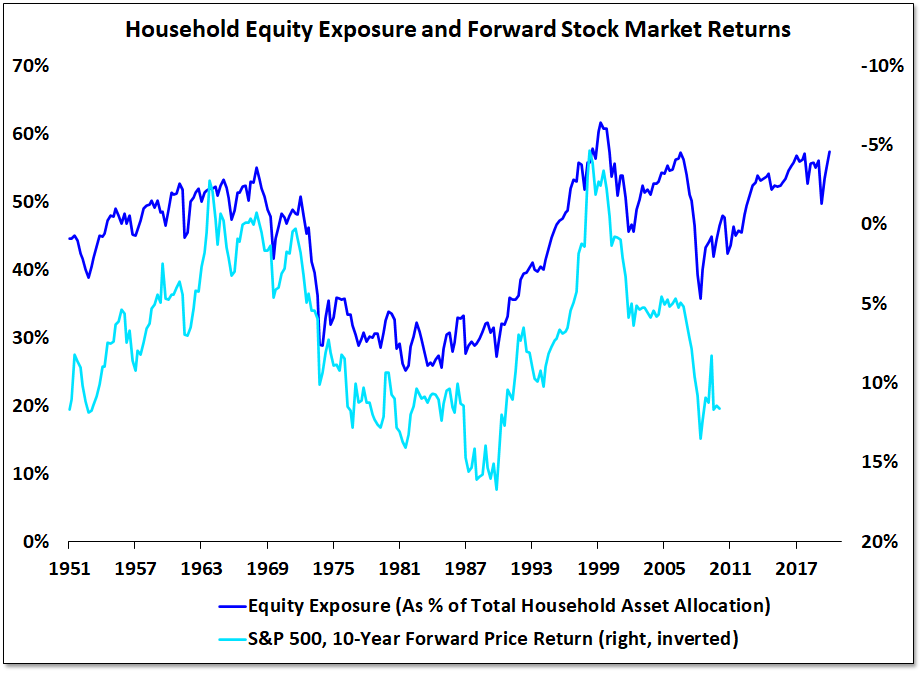
Household equity exposure finished last year near record levels. Preliminary data suggests it has now exceeded its previous peaks. There is a strong inverse correlation between starting household equity exposure and stock market returns over the ensuing decade.
It sure feels like a long time ago now, but it’s been less than a decade since the European Union underwent a rather serious sovereign debt crisis.
This set off a roughly two year bear market for International Stocks as well as a rangebound mess for US stocks.
After this bout of volatility, most risk-assets carved out significant lows in 2016 and rallied higher until global risk peaked in 2018. Then it all fell apart again last year.
This brings us to today, where we’re now seeing European countries and indexes trade right back up to their 2018 or pre-COVID highs left and right.
While diversified global indexes like MSCI EAFE $EFA and MSCI Europe $VGK recently reclaimed their former highs from 2014, 2018, and are already well above their pre-COVID peaks – they are now approaching a far more important area of overhead resistance at their pre-financial crisis highs.
Last week, we used the BRIC countries $BKF to illustrate this theme of more and more international indexes trading at inflection points. Today, we’ll do the same by highlighting some of Developed Europe’s long-term underperformers… the PIGS.
This is the video recording of our May 3, 2021 Monthly Charts Live Strategy Session
From the desk of Steve Strazza @Sstrazza.
Welcome back to our latest “Under The Hood” column for the week ended April 30, 2021. This column is published bi-weekly and rotated on-and-off with our Minor Leaguers column.

In this column, we analyze the most popular stocks during the week and find opportunities to either join in and ride these momentum names higher, or fade the crowd and bet against them.
We use a variety of sources to generate the list of most popular names. There are so many new data sources available that all we need to do is organize and curate them in a way that shows us exactly what we want: A list of stocks that are seeing an unusual increase in investor interest.
Whether we’re measuring increasing interest based on large institutional purchases, unusual options activity, or simply our proprietary lists of trending tickers… there is a lot of overlap.
The bottom line is there are a million ways to skin this cat. Relying on our entire arsenal of data makes us confident that we’re producing the best list each week and gives us more optionality in terms of finding the most favorable trade setups for our clients.


