This is the weekly post that aggregates all the charts we put together throughout the week and organizes them all into one, easy to flip through deck.
Expert technical analysis of financial markets by JC Parets
This is the weekly post that aggregates all the charts we put together throughout the week and organizes them all into one, easy to flip through deck.
From the desk of Steven Strazza @Sstrazza and Ian Culley @Ianculley
There’s always a bull market somewhere.
But the environment is tough right now.
Volatility is sweeping across markets. The dollar is catching a defensive bid. And the major averages continue their downward trajectory as investors desperately look for signs of a bottom.
Yet, despite the bearish action gripping markets, we’re still finding bases we want to buy.
And, to no surprise, many of those smiley faces are in the commodities market.
That’s where we want to focus our attention.
Today, we’ll highlight the wheat complex, outlining some tactical setups that complement our bullish structural outlook for commodities and grains.
Let’s dive in! [Read more…]
From the desk of Steve Strazza @Sstrazza
Our International Hall of Famers list is composed of the 100 largest US-listed international stocks, or ADRs.
We’ve also sprinkled in some of the largest ADRs from countries that did not make the market cap cut.
These stocks range from some well-known mega-cap multinationals such as Toyota Motor and Royal Dutch Shell to some large-cap global disruptors such as Sea Ltd and Shopify.
It’s got all the big names and more–but only those that are based outside the US. You can find all the largest US stocks on our original Hall of Famers list.
The beauty of these scans is really in their simplicity.
We take the largest names each week and then apply technical filters in a way that the strongest stocks with the most momentum rise to the top.
Based on the market environment, we can also flip the scan on its head and filter for weakness.
Let’s dive in and take a look at some of the most important stocks from around the world.
From the desk of Willie Delwiche.
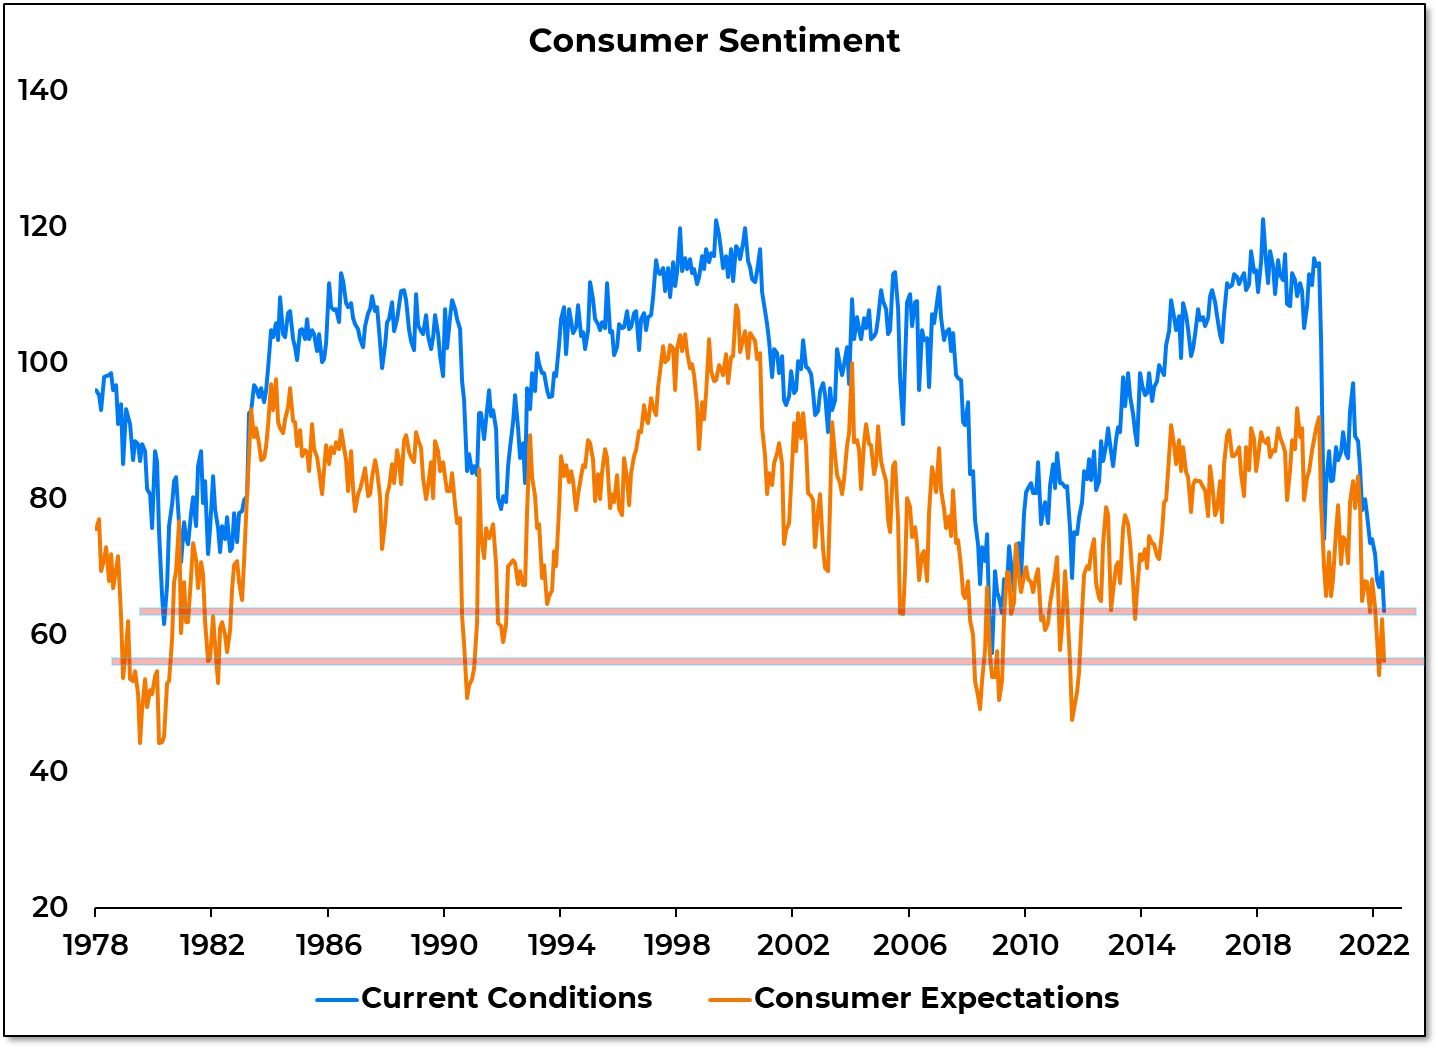
The preliminary May reading for the Consumer Sentiment Index (published by the University of Michigan) dropped to one of its lowest levels on record. The Expectations component is still above its March low, while the view of Current Conditions is at new cycle low – and at its lowest level since late 2008. That’s right – things are seen as worse now than they were at the worst of the COVID-related shutdowns. At one level this seems ludicrous – the S&P 500 is just a few months removed from record highs and pretty much anyone who wants a job can get one. On the other hand, everyone is seeing surging prices at the grocery store and gas station. They see surging balances on their credit card statements, but collapsing balances on their brokerage statements. This an unfamiliar environment for an entire generation of investors who have never experienced a double-digit year-over-year drawdown in the NASDAQ 100. It’s particularly acute for investors who listened to the advice of “experts” and have bought every dip this year. We don’t need to look at this incredulously and suggest things aren’t actually as bad as they have been in the past. Rather, acknowledge that conditions for consumers are getting worse not better and the current mood reflects that.
From the desk of Steven Strazza @Sstrazza and Grant Hawkridge @granthawkridge
Defense wins championships.
It’s important to remind ourselves of this as risk continues to come off the table.
The largest stocks in the world are losing critical support levels, and even the leaders are coming under pressure. Bonds are catching a defensive bid, credit spreads are as wide as they’ve been in years, and investors are fleeing to the dollar for safety.
Meanwhile, the classic risk barometer – the AUD/JPY – is breaking to fresh lows.
This all speaks of defensive positioning.
This is the video recording of the May 12th Weekly Town Hall w/ Willie Delwiche.
05/12/22 2:00 PM ET [Read more…]
From the desk of Willie Delwiche.
Volatility is on the rise and some of the reactions we’re seeing are entirely predictable.
For instance, I’ve seen multiple versions of this chart shared in recent weeks:
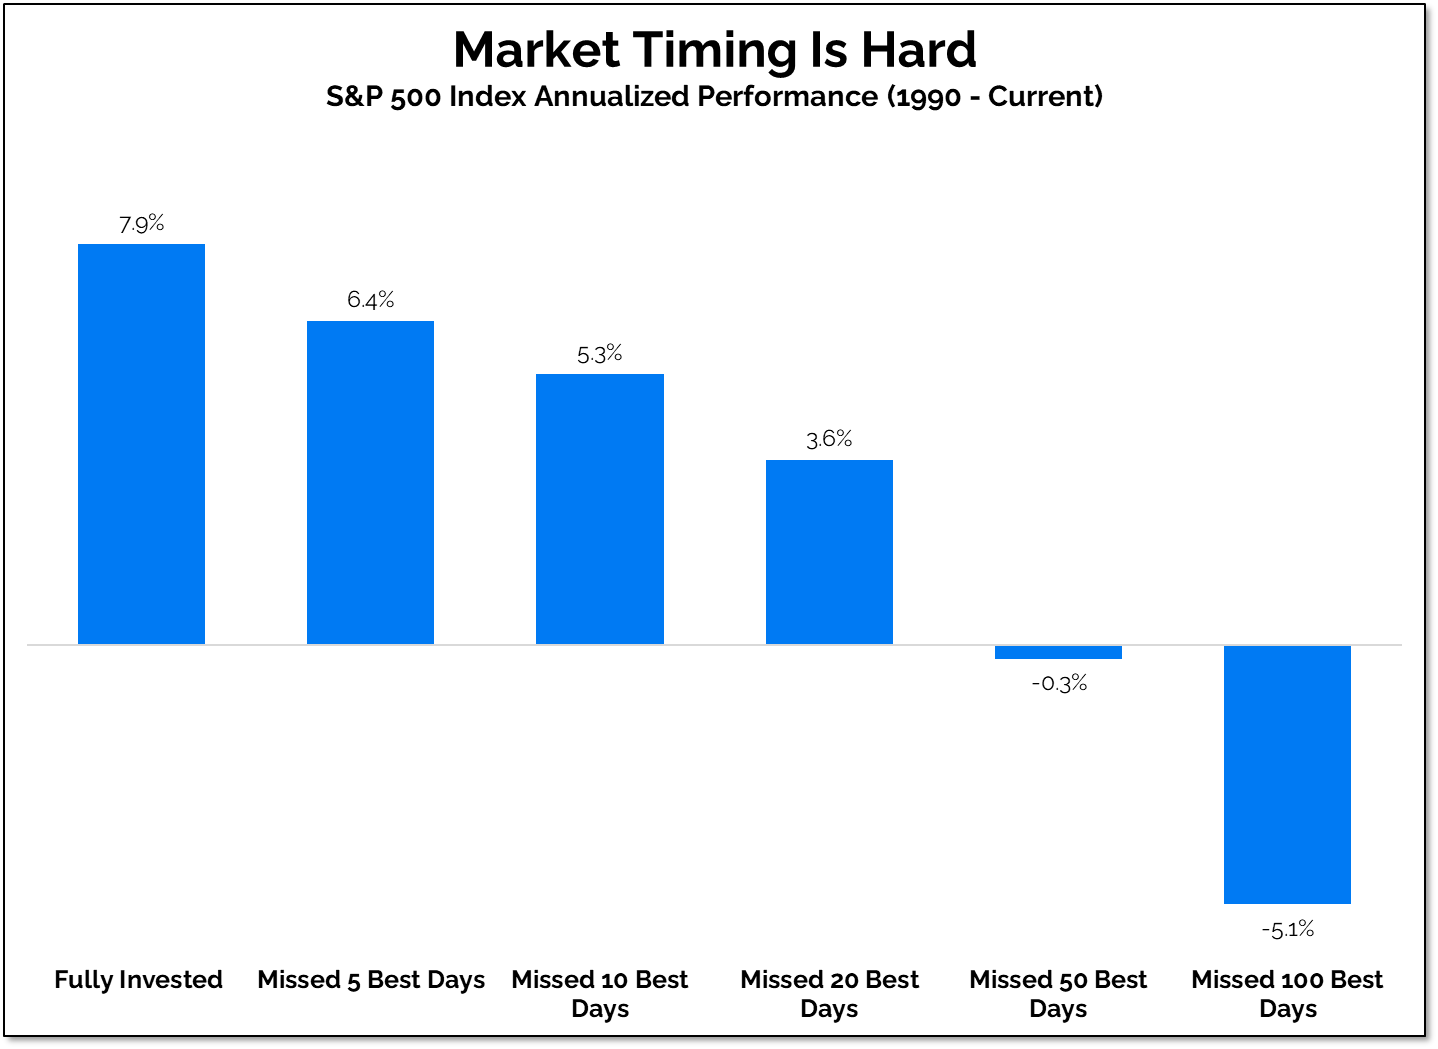
It claims to show how hard it is to effectively time the market. Advisors and strategists use this to scare investors with a seemingly straightforward message: If you miss just a handful of the best days in the market, your returns will suffer.


