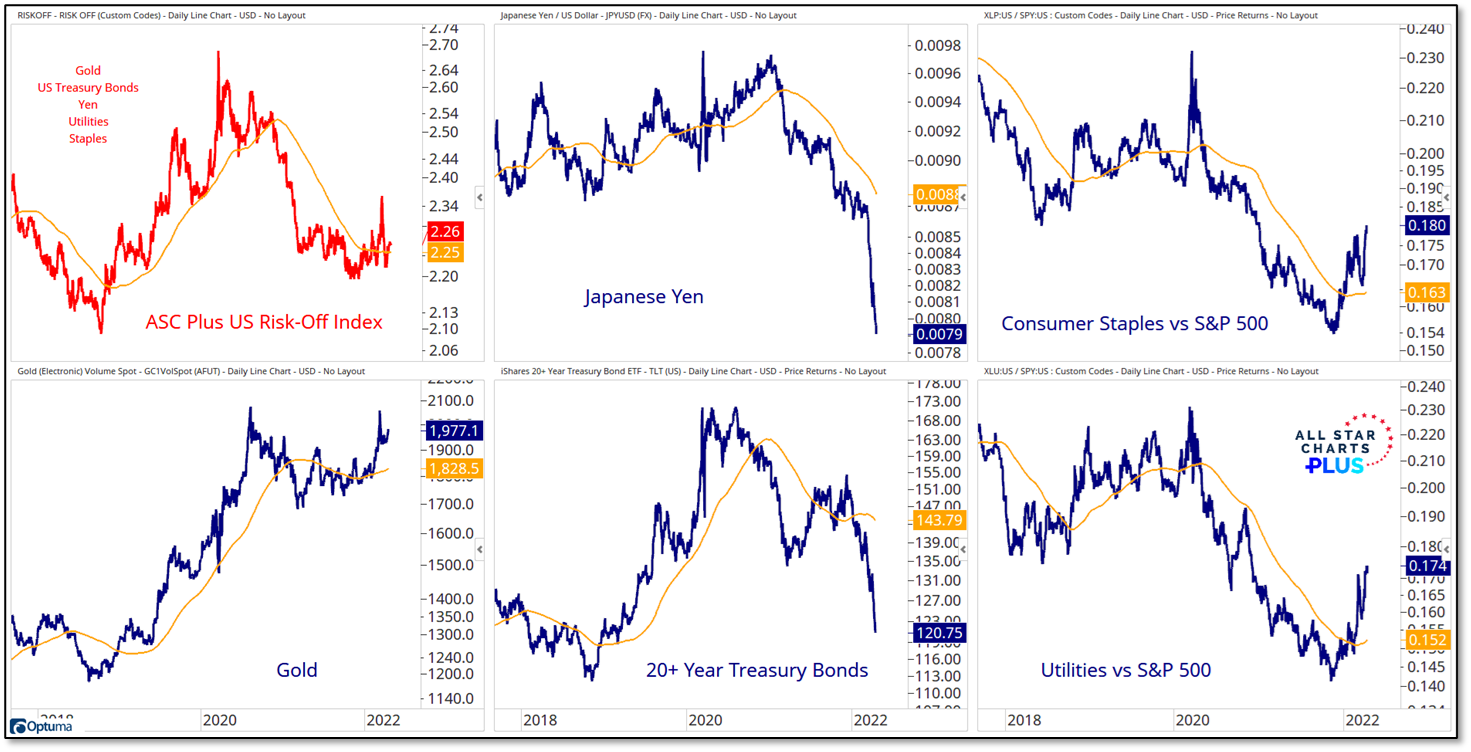
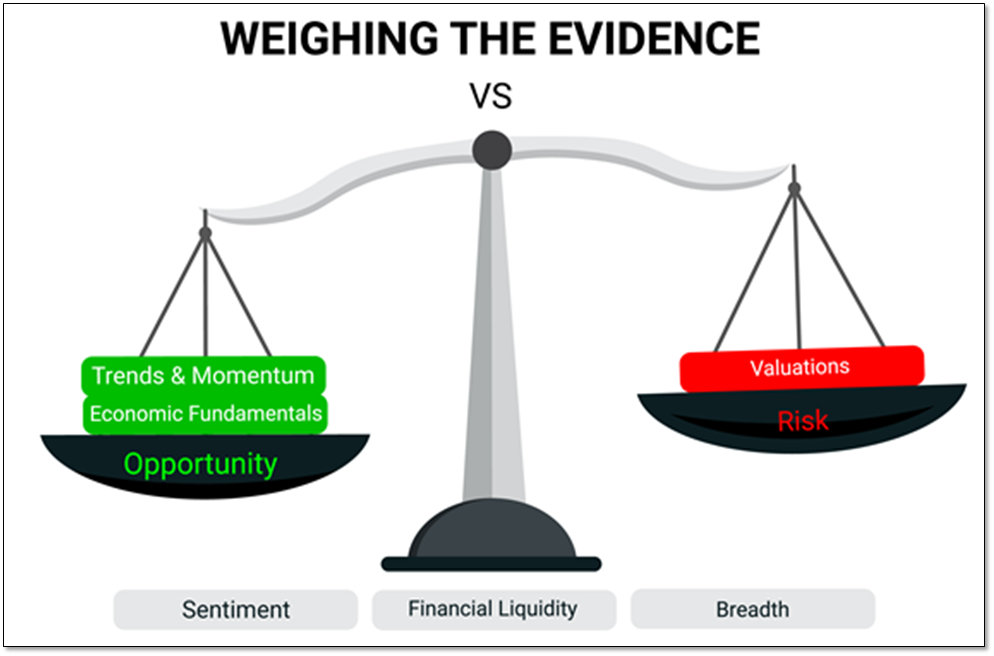
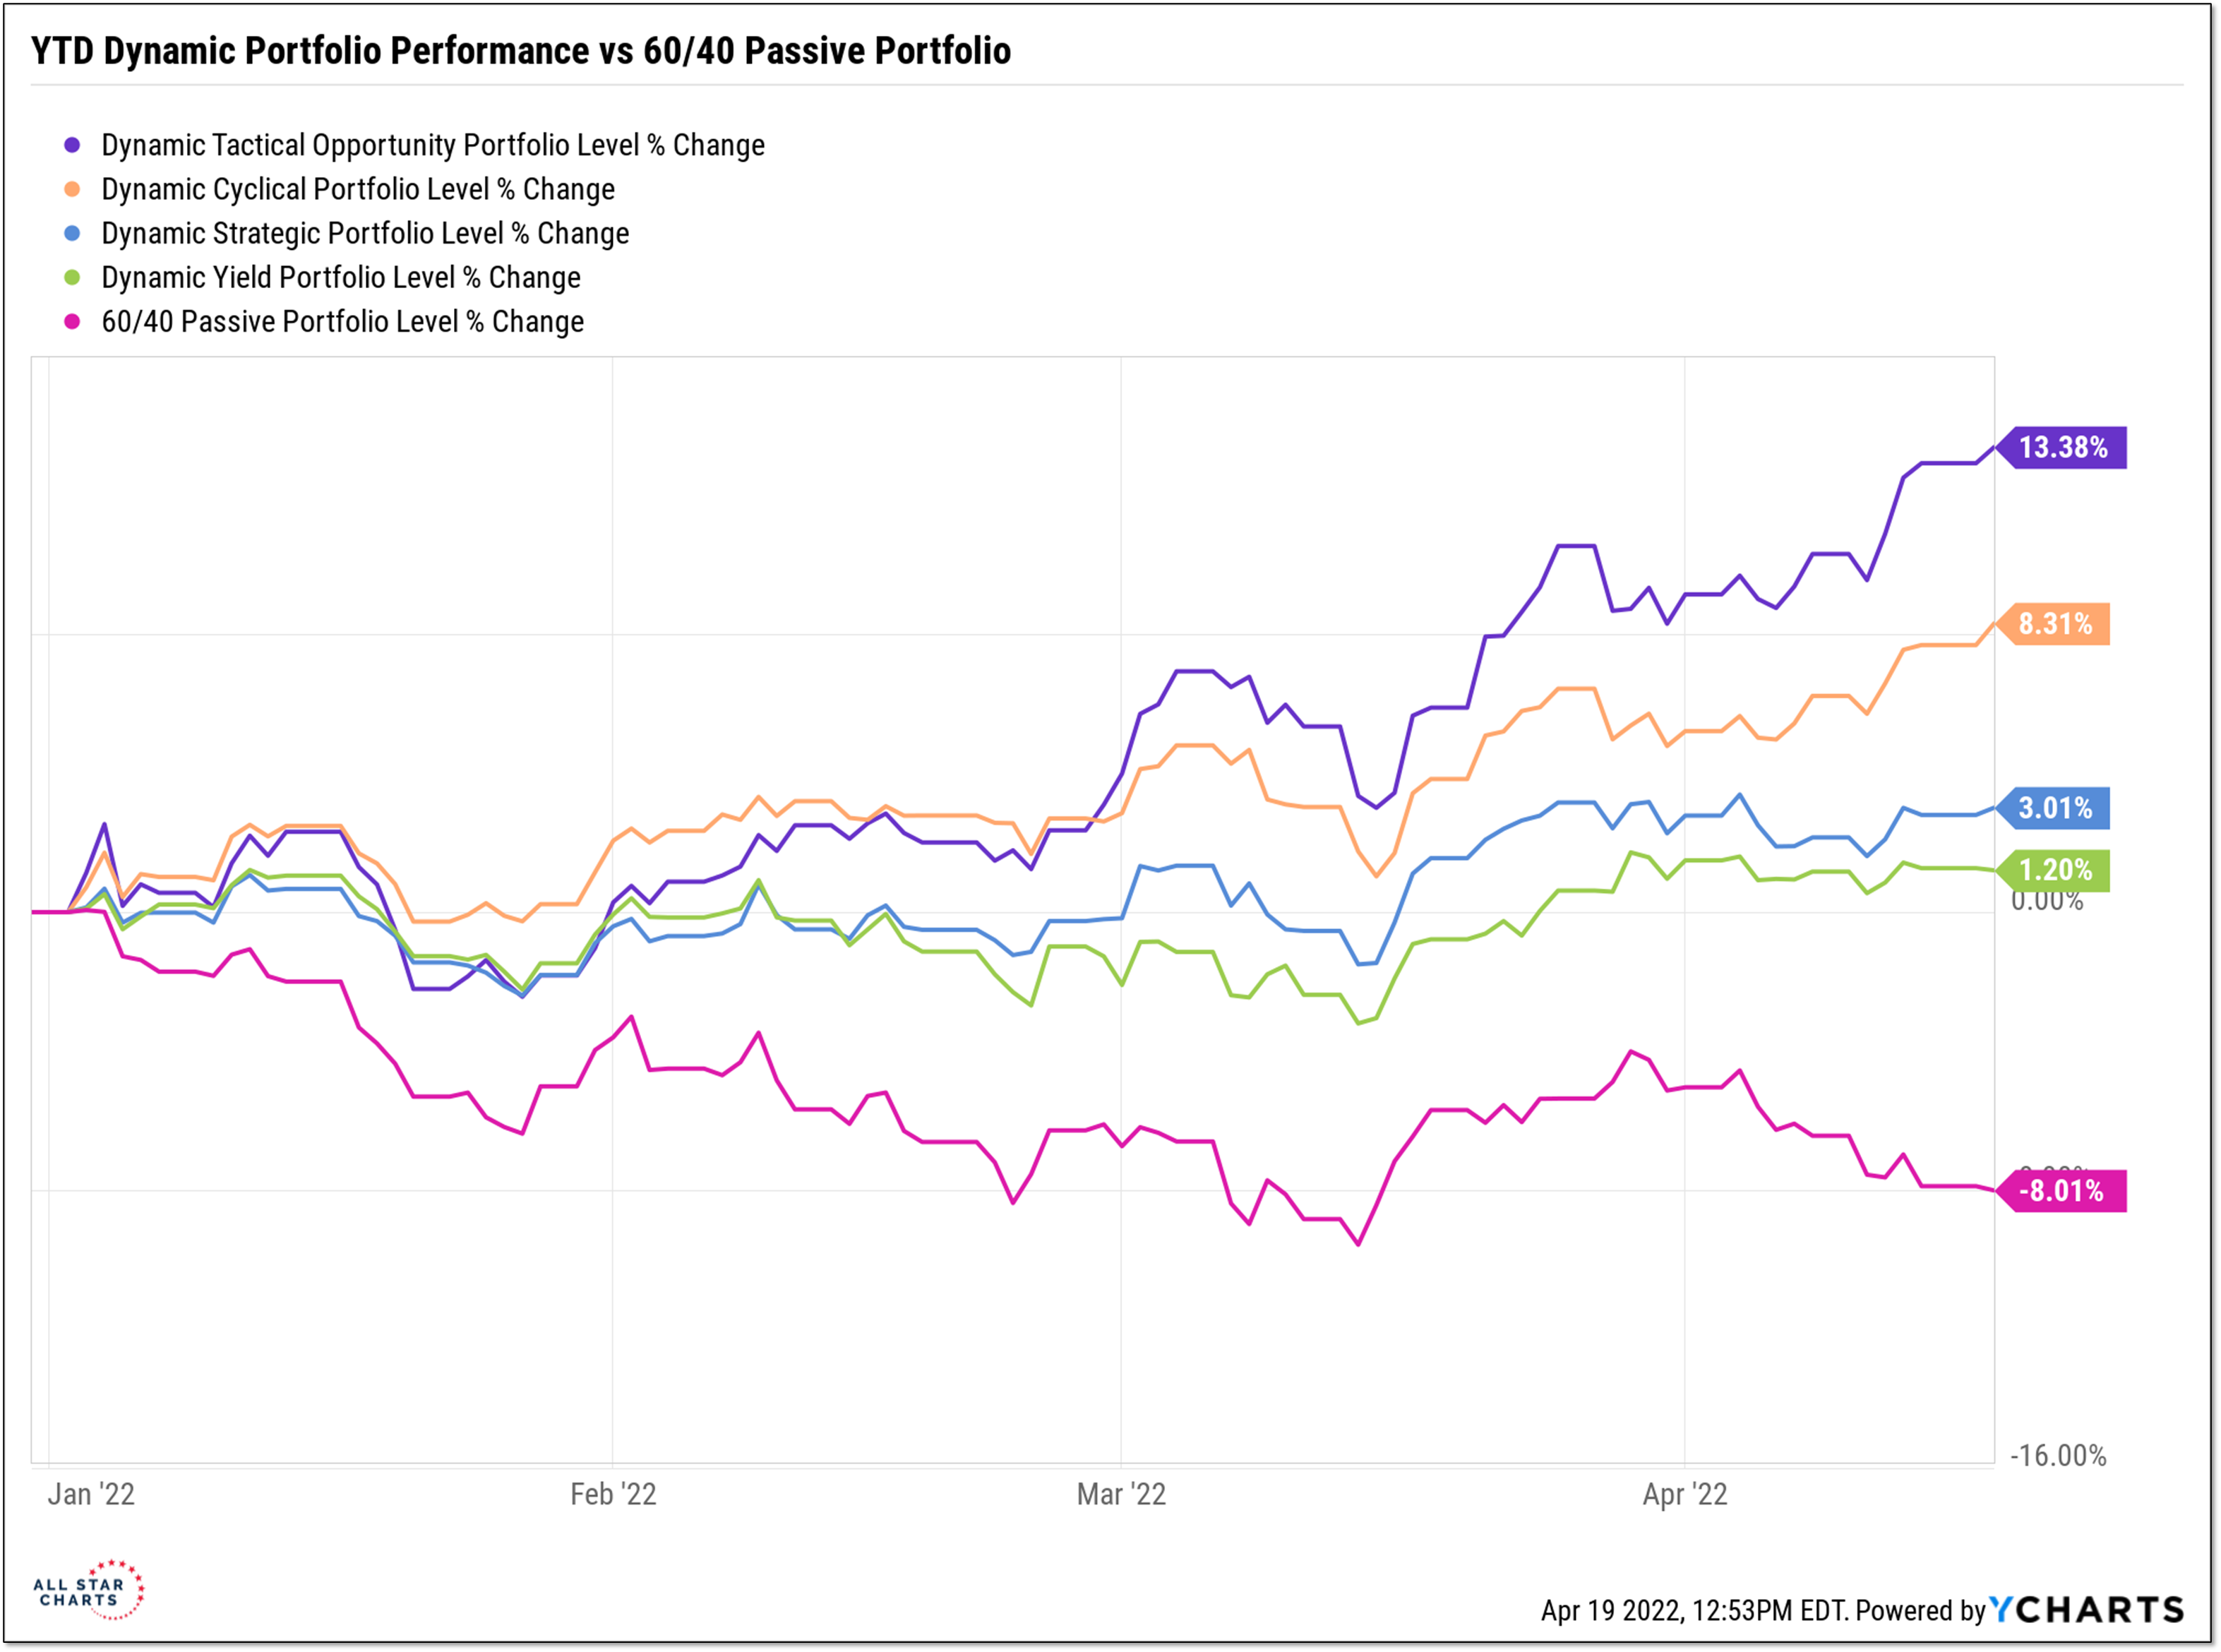
Participating in strength so far in 2022 provides us with some operational flexibility in our Dynamic Portfolios. But in a market with relatively narrow participation, it can be challenging to find ways to move from strength to strength without becoming too concentrated. That said, we are reducing exposure to some of the strongest areas of the market – taking gains more than expecting weakness. We are finding opportunities to maintain our current exposure to the market, increase our diversification and remain consistent with the message of caution coming from our risk indicators and the weight of the evidence. This remains an environment that favors a dynamic over passive approach and one in which being tactical and cyclical enhance strategic exposure.
[Premium] Mid-Month Conference Call Video Recording April 2022
Under the Hood (04-18-2022)
From the desk of Steve Strazza @Sstrazza.
Welcome back to our latest Under the Hood column, where we’ll cover all the action for the week ended April 15, 2022. This report is published bi-weekly and rotated with our Minor Leaguers column.
What we do here is analyze the most popular stocks during the week and find opportunities to either join in and ride these momentum names higher, or fade the crowd and bet against them.
We use a variety of sources to generate the list of most popular names.
There are so many new data sources available that all we need to do is organize and curate them in a way that shows us exactly what we want: a list of stocks that are seeing an unusual increase in investor interest.
Watch this video for a behind-the-scenes look at our process.
Whether we’re measuring increasing interest based on large institutional purchases, unusual options activity, or simply our proprietary lists of trending tickers, there’s a lot of overlap.
Follow the Flow (04-18-2022)
From the desk of Steve Strazza @sstrazza
This is one of our favorite bottom-up scans: Follow the Flow.
In this note, we simply create a universe of stocks that experienced the most unusual options activity — either bullish or bearish… but NOT both.
We utilize options experts, both internally and through our partnership with The TradeXchange. Then, we dig through the level 2 details and do all the work upfront for our clients.
Our goal is to isolate only those options market splashes that represent levered and high-conviction, directional bets.
We also weed out hedging activity and ensure there are no offsetting trades that either neutralize or cap the risk on these unusual options trades.
What remains is a list of stocks that large financial institutions are putting big money behind.
They’re doing so for one reason only: because they think the stock is about to move in their direction and make them a pretty penny.
Then we flip through our list of stocks flashing unusual activity and pick the best setups using many of the same technical filters we do for our other scans.
And, just like that, we’ll follow the money flow and fatten our own pockets along with some of the world’s most powerful financial institutions.
[PLUS] Weekly Momentum Report & Takeaways
From the desk of Steve Strazza @Sstrazza
Check out this week’s Momentum Report, our weekly summation of all the major indexes at a Macro, International, Sector, and Industry Group level.
By analyzing the short-term data in these reports, we get a more tactical view of the current state of markets. This information then helps us put near-term developments into the big picture context and provides insights regarding the structural trends at play.
Let’s jump right into it with some of the major takeaways from this week’s report:
* ASC Plus Members can access the Momentum Report by clicking the link at the bottom of this post.
[PLUS] Weekly Top 10 Report
From the desk of Steve Strazza @Sstrazza
Our Top 10 Charts Report was just published.
In this weekly note, we highlight 10 of the most important charts or themes we’re currently seeing in asset classes around the world.
Tech Weighs Heavy on US Stocks
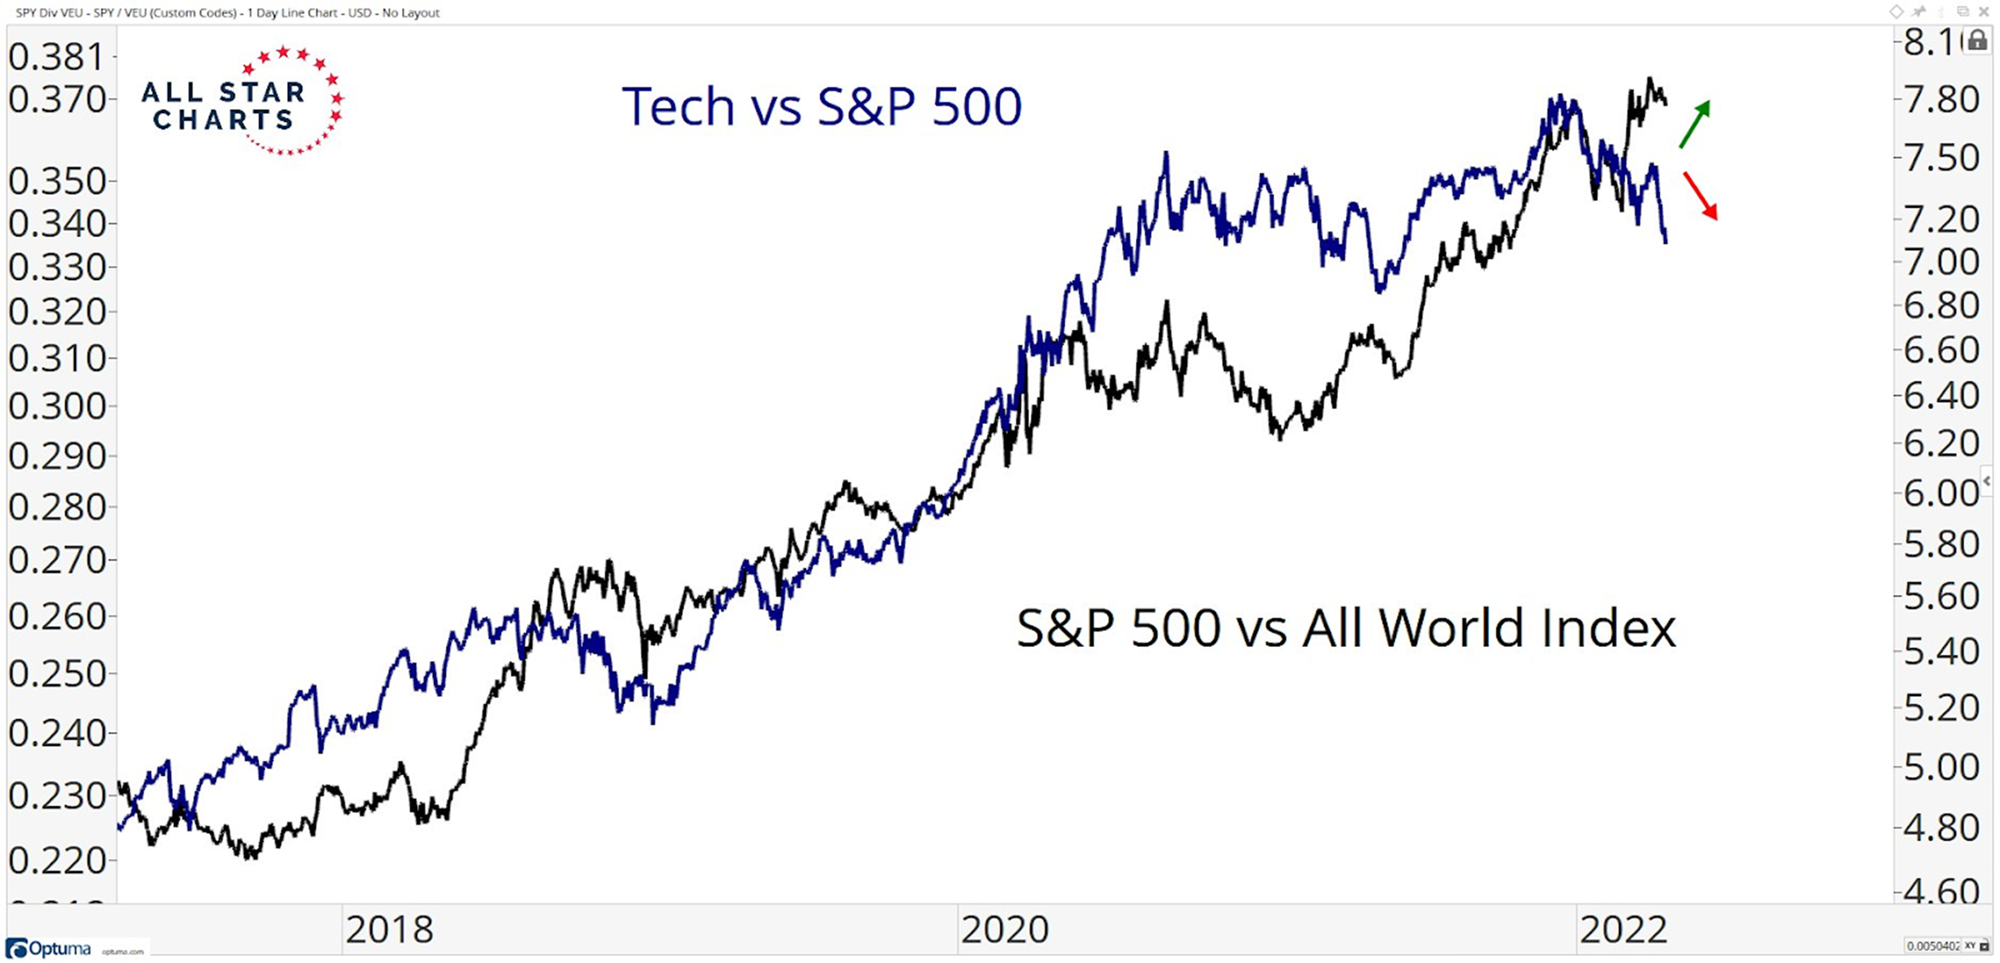
US equities have outperformed their global counterparts for the better part of the last decade. This is largely attributed to the vast differences between the weighting and composition of US and international markets – mainly, the heavy weighting toward technology in the US and the relative absence of tech outside the US.
The overlay chart of Tech vs. the S&P 500 and the S&P 500 vs. the ACWI All World Index ratios tell the story. Tech dominance in the US strongly correlates with US dominance over global markets. With tech taking the brunt of the recent selling pressure, it calls into question the continued outperformance of US equities. This reiterates the possibility that what has worked for the past decade may not work in the years that lie ahead. Position accordingly…
[PLUS] Weekly Market Notes & Breadth Trends
Key Takeaway:
- Optimism fades as risk off reigns.
- Inflation hopes spring eternal.
- Beneath the global trends it’s Pax Britannica.
Get The STEPN
- « Previous Page
- 1
- …
- 301
- 302
- 303
- 304
- 305
- …
- 628
- Next Page »