This is the video recording of the February 17th Weekly Town Hall w/ Willie Delwiche
02/17/22 2:00 PM ET [Read more…]
Expert technical analysis of financial markets by JC Parets
This is the video recording of the February 17th Weekly Town Hall w/ Willie Delwiche
02/17/22 2:00 PM ET [Read more…]
From the desk of Willie Delwiche.
I’m reading the book “Trillions” by Robin Wigglesworth right now. It’s about the rise of passive index investing – or, according to its sub-title, “How a band of Wall Street renegades invented the index fund and changed finance forever.”
It’s been an enjoyable read so far. I’m about halfway through the book and am excited to see how it finishes.
While Wigglesworth’s book has been written and published, the story of passive investing overall remains unfinished. If it is like other investing fads that have come and gone, some of the most exciting times (for better or worse) may lie ahead. History is littered with investment approaches that move from novelty to seemingly foolproof only to end in heartbreak and tears for those left holding the bag.
These are the registration details for our live mid-month conference call for Premium Members of All Star Charts.
Our next Live Call will be held on Tuesday February 22nd at 6PM ET. As always, if you cannot make the call live, the video and slides will be archived and published here along with every other live call since 2015.
Here are the details for Tuesday night: [Read more…]
What’s the trade today?
Is it a long? Is it a short?
Is it a neutral trade?
In today’s video, Sean and I talk about what to do when there’s nothing to do!
From the desk of Steven Strazza @Sstrazza and Ian Culley @IanCulley
Consolidation and range-bound action have dominated the currency market since late last year.
While commodities and cyclical stocks — especially energy — continue to catch a bid, commodity-centric currencies like the Australian and Canadian dollars fail to show any definitive signs of strength.
At the same time, the US dollar isn’t doing much either, as the US Dollar Index $DXY has been chopping sideways for several months.
Long story short, indecision is the overarching theme for forex markets at the moment.
One forex pair that does an excellent job of illustrating the trendless nature of these markets is the AUD/JPY.
From the desk of Steve Strazza @Sstrazza
Welcome to the 2 to 100 Club.
As many of you know, something we’ve been working on internally is using various bottom-up tools and scans to complement our top-down approach. It’s really been working for us!
One way we’re doing this is by identifying the strongest growth stocks as they climb the market-cap ladder from small- to mid- to large- and, ultimately, to mega-cap status (over $200B).
Once they graduate from small-cap to mid-cap status (over $2B), they come on our radar. Likewise, when they surpass the roughly $30B mark, they roll off our list.
But the scan doesn’t just end there.
We only want to look at the strongest growth industries in the market, as that is typically where these potential 50-baggers come from.
Some of the best performers in recent decades – stocks like Priceline, Amazon, Netflix, Salesforce, and myriad others – would have been on this list at some point during their journey to becoming the market behemoths they are today.
When you look at the stocks in our table, you’ll notice we’re only focused on technology and growth industry groups such as software, semiconductors, online retail, solar, etc.
Then, like any good technician, we filter the list down to those closest to new highs.
This allows the cream of these strong groups to rise to the top and helps streamline our mission to identify technical breakouts in the top-performing stocks.
From the desk of Willie Delwiche.
Key Takeaway: Speculative excesses have been unwinding for a year and that has taken its toll on investor sentiment. The overall mood is characterized by a lack of optimism rather than rampant pessimism. This is consistent with the grind lower in many areas of the market since new highs peaked in February 2021. The damage done beneath the surface has only in recent months impacted the indexes, but if that impact intensifies a further expansion in pessimism would not be surprising. Benchmark 60/40 portfolios have gotten off to their worst start in a quarter century and our strategic positioning indicators continue to point to a high risk backdrop. If there isn’t much of a reward at the end of the volatility rollercoaster, passive participants may start to actively question whether the ride was worth it.
Sentiment Report Chart of the Week: Unwind Continues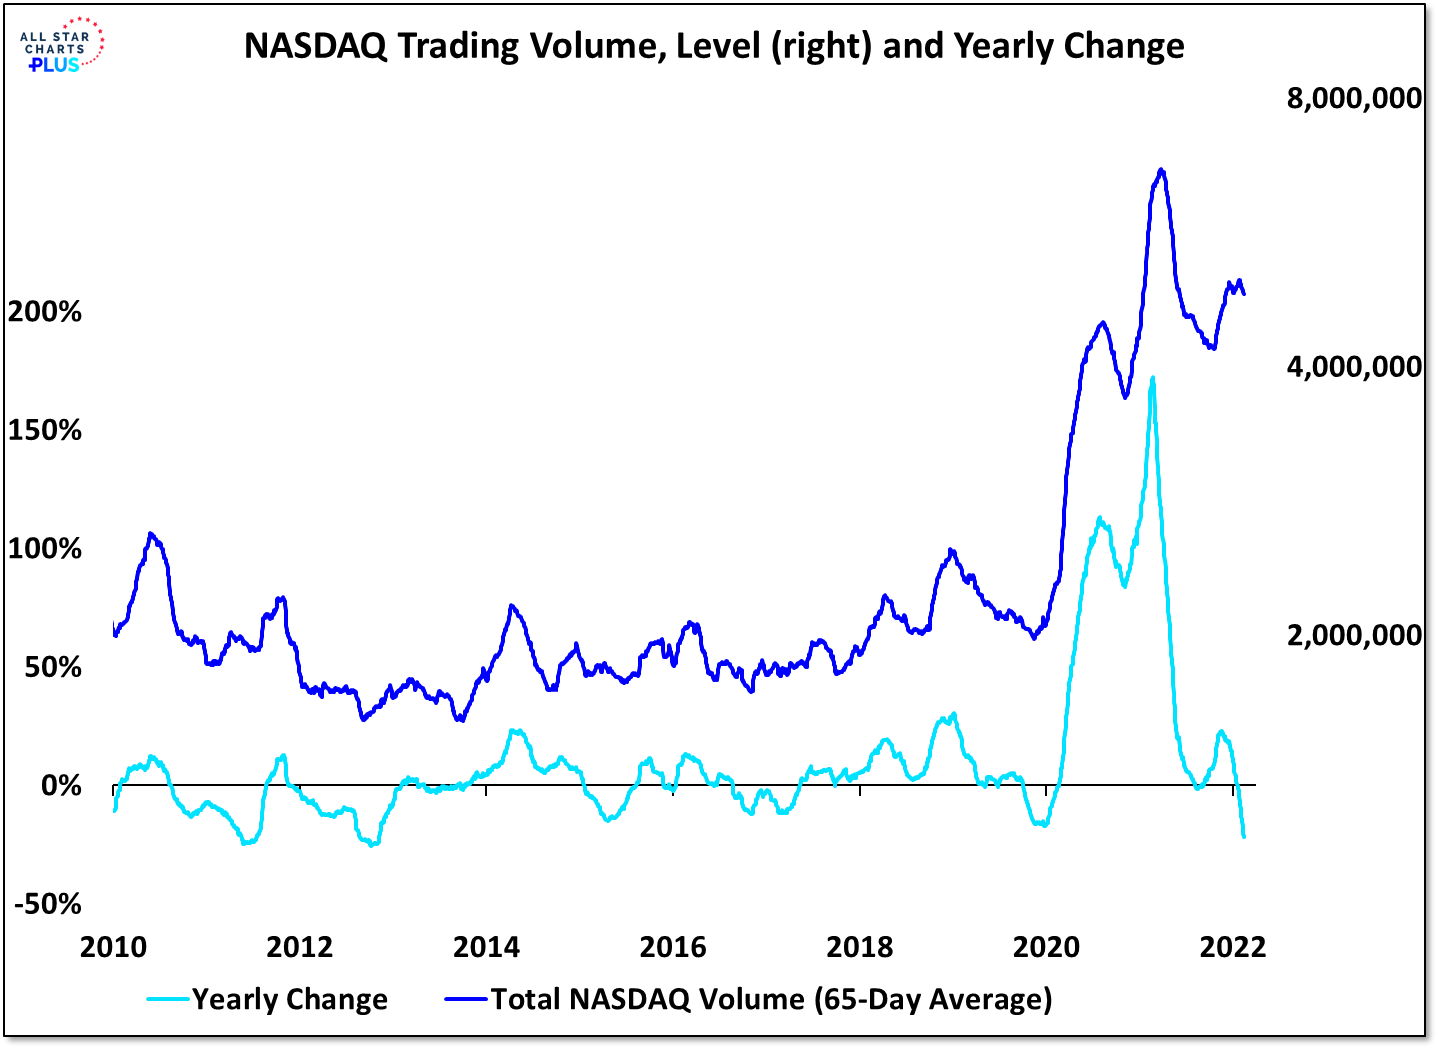
While the popular averages peaked more recently, there is plenty of evidence to suggest we are now a year into an unwind in speculative activity. This time last year, more than a quarter of the issues on the NYSE+NASDAQ were hitting new highs (the peak for the cycle) and NASDAQ trading volume was 150% higher than it had been the year prior. Fast forward to this year and we see half of the stocks on the NYSE and three-quarters of the stocks on the NASDAQ are down 20% or more from their highs (nearly half of the stocks on the NASDAQ have been cut in half). NASDAQ trading volume is 20% (and falling) lower than it was a year ago. Sentiment is sour and the risk appetite unwind continues. The question isn’t whether US stocks are going to enter a new bear market, but when they will emerge from the one that many find themselves in already.


