This is the video recording of the November 11th Weekly Town Hall w/ Willie Delwiche
11/11/21 3PM ET [Read more…]
Expert technical analysis of financial markets by JC Parets
This is the video recording of the November 11th Weekly Town Hall w/ Willie Delwiche
11/11/21 3PM ET [Read more…]
From the desk of Willie Delwiche.
After my daughter’s flight landed in Minneapolis, she had to hurry through the terminal to catch a bus for the ride that would complete the final leg of her trip back to college. She did a great job of navigating uncertainties and asking for directions. She went where she was told and saw people, but no bus. “Just wait here,” she was told, “the bus shows up, you get on, and it leaves right away.”
A couple of buses came, some people got on, the buses left. Meanwhile, her ride was still a no-show.
But people who appeared to be in-the-know said she was in the right spot.
So she waited.
These are the registration details for our live mid-month conference call for Premium Members of All Star Charts.
Our next Live Call will be held on Tuesday November 16th at 6PM ET. As always, if you cannot make the call live, the video and slides will be archived and published here along with every other live call since 2015.
Here are the details for Tuesday night: [Read more…]
From the desk of Steven Strazza @Sstrazza and Ian Culley @IanCulley
Last week, we touched on the weakness that’s been developing further out on the yield curve.
The long end simply hasn’t kept pace with shorter-term yields. This is understandable given the magnitude of the move in the 30-year since summer 2020. At some point, the shorter end of the curve needs to play catch up. And it’s done just that these past couple months.
Now it’s time to focus on longer-term rates, as further downside pressure will eventually put the current economic recovery into question.
Let’s put the recent action in rates into perspective as we head into year’s end. [Read more…]
From the desk of Willie Delwiche.
Key Takeaway: The bulls are back as more and more investors begin to reach for risk. Optimism is expanding across investor surveys and active equity managers have increased their exposure to levels not seen since the beginning of the year. This fresh bout of risk-seeking behavior comes as both momentum and price trends have turned bullish. Also, participation beneath the surface is expanding as the major indexes reach record highs. Combine this backdrop with a healthy number of stubborn bears and we have an environment that supports the next leg higher.
Sentiment Report Chart of the Week: Appetite For Risk Returns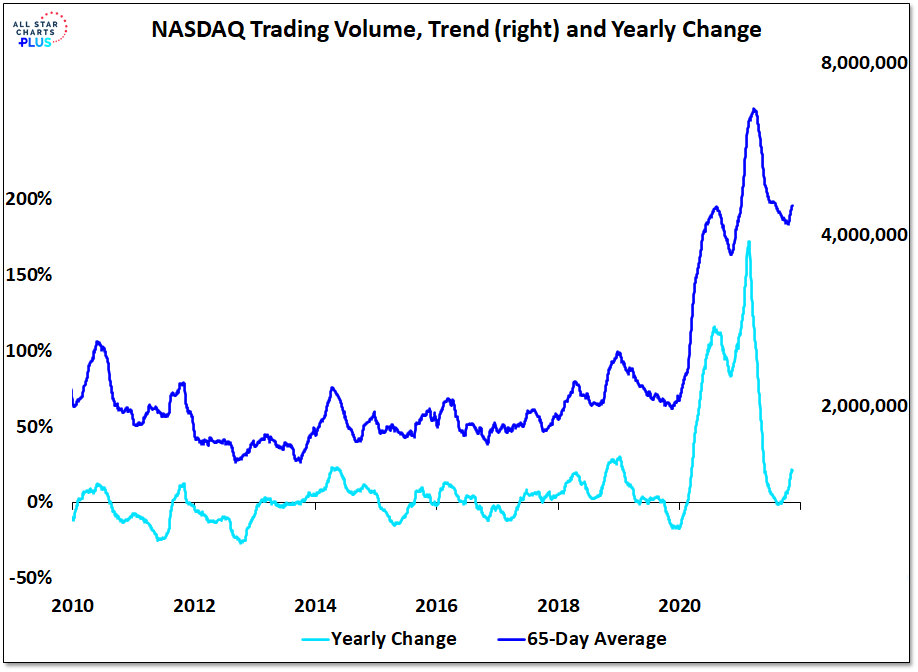
Investors are not just feeling more optimistic, they are doing something about it. NASDAQ trading volume, which fell by nearly 30% from March to October, has turned higher in recent weeks and is 20% higher than it was this time last year. Equity call option activity has also expanded as investors are stepping back up to the ‘risk on’ buffet after a multi-month fast.
Today’s post has inspired today’s musical soundtrack that is oozing out my speakers as I type this.
The Rolling Stones’ album Exile on Main St marked a turning point in the trajectory of Rolling Stones lore.
And it feels fitting as today’s trade idea has Main Street in its name and it, too, is exhibiting classic characteristics of a major breakout. [Read more…]
From the desk of Steven Strazza @Sstrazza
*** Click here to read the reveal post for this Mystery Chart ***
Check out our latest Mystery Chart!
What we do here is take a chart that’s captured our attention, and remove the x and y-axes as well as any other labels that could help identify it.
This chart can be of any security, in any asset class, on any timeframe. Sometimes it’s an absolute price chart, other times it’s on a relative basis.
It might be a ratio, a custom index, or maybe the price is inverted. It could be all three!
The point is, when we aren’t able to recognize what’s in front of us, we put aside any biases we may have and scrutinize the price behavior objectively.
While you can try to guess the chart, the point is to make a decision…
So, let us know what it is… Buy, Sell, or Do Nothing?
From the desk of Steven Strazza @Sstrazza and Ian Culley @IanCulley
Correlations often work… until they don’t. It’s just the nature of intermarket relationships.
We can see a prime example in the recent action between the US dollar and risk assets.
The dollar has been marching to the beat of its own drum, as it’s shown an unusually strong positive correlation with commodities since this summer.
Although the inverse correlation is not as strong with equities, it still exists. But the USD’s resilience during the second half of this year hasn’t stopped stocks from screaming higher.
While we definitely aren’t in an environment where USD weakness is a tailwind, the evidence continues to stack up in favor of the bulls and risk assets.
The dollar is just one data point. But it’s a rather important one, as the direction of King Dollar has proven to have a profound impact on other asset classes.
Today, we’re going to highlight the decoupling of USD relationships and what it could mean for the rally in risk assets.
Let’s dive in!


