This is the video recording of the August 26 Town Hall Meeting w/ Willie Delwiche
08/26/21 2PM ET [Read more…]
Expert technical analysis of financial markets by JC Parets
This is the video recording of the August 26 Town Hall Meeting w/ Willie Delwiche
08/26/21 2PM ET [Read more…]
From the desk of Willie Delwiche.
I’m not the biggest sports fan in the world.
This probably makes me a bit of an All Star Charts outlier. I don’t watch many games of any kind (especially during the regular season). Nor am I a good source for offseason updates or perspectives on roster moves and coaching changes…
But now’s a great time to be interested (even casually) in the Milwaukee sports scene. We had the Bucks winning the NBA championship earlier this summer. Now the Brewers have one of the best records in all of baseball and a division lead that’s approaching double-digits heading into the final month of the regular season.
I keep tabs on the Brewers the old-fashioned way–reading about them in the newspaper. This morning, I came across this quote from Kolten Wong, second baseman and leadoff hitter:
“You’re competing against pitchers who are throwing 100 (mph), command three or four pitches. Guys don’t really care if you’re in a slump at this level; they’re going to continue to bury you.”
That perspective transcends baseball. It’s a warning that applies directly to investing. The environment can be challenging, and the market can throw a lot at you. If you fall behind and press, it’s all too easy to get buried.
But Wong follows up with this wisdom:
“I just understand a lot more now. I understand how hard this game is. My outlook on the game is different. I’m just going out there and competing, trying to do whatever I can to have a good at-bat and the results will take care of itself.”
Even when the game gets messy, don’t press. Don’t try to mimic someone else’s process or wish for a different market. Neither of those “solutions” are going to lead to great outcomes.
Instead, maintain your discipline and stay focused on your process.
This may include taking some time to better understand the theories and principles you bring to your observations and actions. As Darwin said, “You cannot observe without a theory.”
Take what the market gives you and work with it. Turn theory into practice.
Is it a messy market right now? Absolutely… has been for months.
Is it difficult to stay focused on your plan and your approach? Yes. Now and always.
But when we understand what is under our control and stay focused, results follow.
The Brewers are proving it on the baseball diamond. We can see it in the market, too.
From the desk of Steve Strazza @sstrazza and Grant Hawkridge @granthawkridge
Whether more stocks are going up or down these days simply depends on where you look. Some advance-decline lines are moving higher, but others are moving lower.
Weakness and divergences in these indicators are more often than not resolved over time, but the longer they persist the more concerning they become.
This hasn’t been an issue for most of the major averages, as the S&P 500 and other large-cap indexes keep making new highs with confirmation from their A/D lines.
Yet when we look beneath the surface, and particularly down the cap scale, we’re seeing a different story. Ultimately, some stocks are going up, but most are not.
You’ve probably heard already, but the current environment is an absolute mess as the weight of the evidence continues to hang in the balance. In today’s post, we’ll discuss some charts that do a great job illustrating all the mixed signals out there right now.
On August 25th, Sean and JC hopped on a Twitter Live Stream to discuss a recent trade idea for All Star Charts Options Members.
Here’s the play:
“We’re selling naked short $GDXJ October 39 puts here for an approximately $1.08 credit”
To learn more about the trade and the thinking behind it, click below to watch a replay of the Live Stream.
Seasonality of markets is something I’ve done a lot of work on throughout my career. As humans who are part of society, we behave differently depending on the seasons. We dress differently, we hang out with different people, we go to different places, all according to a calendar.
If you think those behavior changes don’t impact our decision making, then I don’t think you understand humans. And if you think those behaviors and decisions don’t affect how we participate in markets, then I think you’re just being naïve.
I encourage you to pick up a copy of the annual Stock Traders Almanac published by my pal Jeff Hirsch.
Yesterday after the close, I had a great chat with Ed Clissold, the Chief U.S. Strategist at Ned Davis Research. The podcast episode will be up shortly, so keep an eye out for it. You can subscribe to my Technical Analysis Radio Podcast here, if you haven’t already.
One of the things we discussed was the S&P500 Cycle Composite for 2021. In this chart, we’re looking at a composite of the annual seasonal cycle, the decennial cycle and the presidential cycle: [Read more…]
From the desk of Willie Delwiche.
Key Takeaway: It appears the bulls are preparing to pack it up and call it a day. Dark clouds are starting to roll in, as the slow deterioration beneath the surface has taken its toll. New highs and a relentless rally in the major indexes paint an alternate reality versus the experience of the average stock–a reality that hasn’t quite sparked the interest of the bears so much as it’s exhausted the bulls. Active investment managers continue to taper their exposure, and advisory services have turned their least bullish in more than a year. A storm is brewing in the form of a re-set in sentiment. As it inches closer, the question becomes more of “when” and “how,” not “if.”
Sentiment Report Chart of the Week: New lows in new highs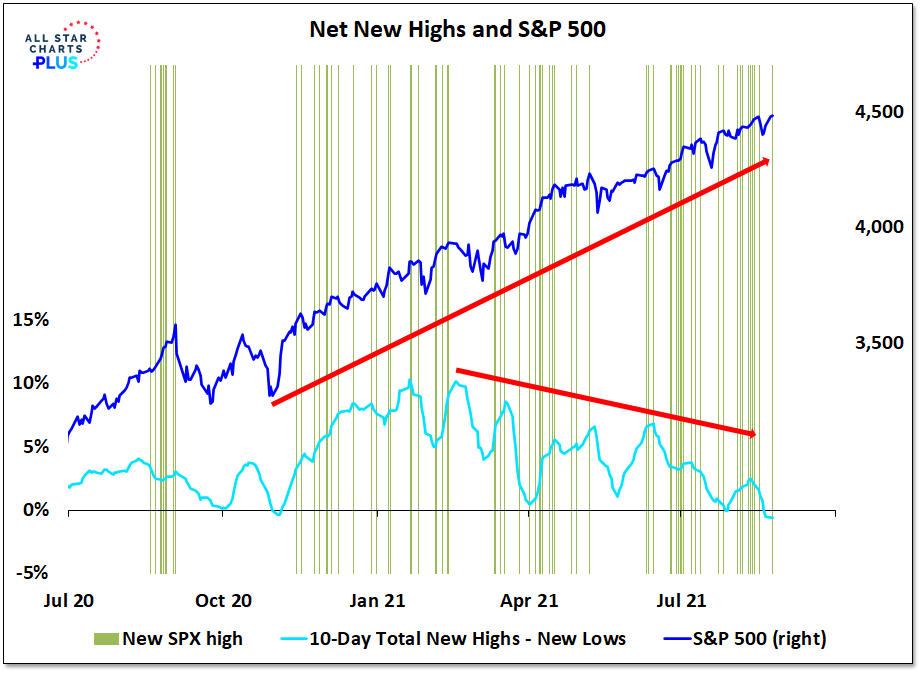
Indexes are making new highs, but beneath the surface the case for more caution on the part of investors makes more sense. There are many ways to describe the deterioration that’s been ongoing for months now. Here’s one more: For only the second time in the past two decades, the S&P 500 Index made a new high while more stocks on the NYSE+NASDAQ have been making new lows.
This week I had a chance to chat with my old pal Phil Pearlman, who’s the Chief Behavioral Officer at Osprey Funds.
Phil and I have been talking markets regularly for over a decade, both behind the scenes and on YouTube.
Never in our wildest dreams did we think we would be here today discussing on-chain analysis of crypto currencies. But here we are!
In today’s video we discuss two of my favorite gauges of sentiment, the exchange balances and the dormancy rates. We also touch on the current breadth in crypto markets as the percentage of coins breaking out to new 30 day highs continues to expand.
From the desk of Steven Strazza @Sstrazza
Check out our latest Mystery Chart!
What we do here is take a chart that’s captured our attention, and remove the x and y-axes as well as any other labels that could help identify it.
This chart can be any security, in any asset class, on any timeframe. Sometimes, it’s an absolute price chart. Other times, it’s on a relative basis.
It might be a ratio, a custom index, or maybe the price is inverted. It could be all three!
The point is, when we aren’t able to recognize what’s in front of us, we put aside any biases we may have and scrutinize the price behavior objectively.
While you can try to guess the chart, the point is to make a decision…
So let us know what it is… Buy, Sell, or Do Nothing?


