This is our ASC Research Q3 2021 Playbook.
- Stocks (International & U.S.)
- U.S. Sectors & Industries
- Market Breadth & Sentiment
- Commodities
- Currencies
- Intermarket Analysis
- Crypto Currencies
- New Trade Ideas
- Overall Strategy
Expert technical analysis of financial markets by JC Parets
This is our ASC Research Q3 2021 Playbook.
From the desk of Steve Strazza @Sstrazza
Welcome to the 2 to 100 Club.
Our apologies for the late delivery as we’ve all been so buried in charts preparing our Q3 Playbook that we forgot about this week’s column!
As many of you know, something we’ve been working on internally is using various ‘bottoms-up’ tools and scans to complement our top-down approach.
One way we’re doing this is by identifying the strongest growth stocks as they climb the market-cap ladder from small, to mid, to large – and ultimately mega-cap status (over $200B).
Once they graduate from small-cap to mid-cap status (over $2B) they come on our radar. Likewise, when they surpass the roughly $30B mark, they roll off our list.
But the scan doesn’t just end there. We only want to look at the strongest growth industries in the market as that is typically where these potential 50-baggers come from.
Some of the best performers in recent decades – stocks like Priceline, Amazon, Netflix, and Salesforce, to a myriad of others… all would have been on this list at some point during their journey to becoming the market behemoths they are today.
When you look at the stocks in our table you will notice we are only focused on technology and growth industry groups such as Software, Semiconductors, Online Retail, Solar, etc.
Then like any good technician, we filter the list down to those that are closest to new highs. This allows the cream of these strong groups to rise to the top and helps streamline our mission to identify technical breakouts in the top-performing stocks.
From the desk of Willie Delwiche.
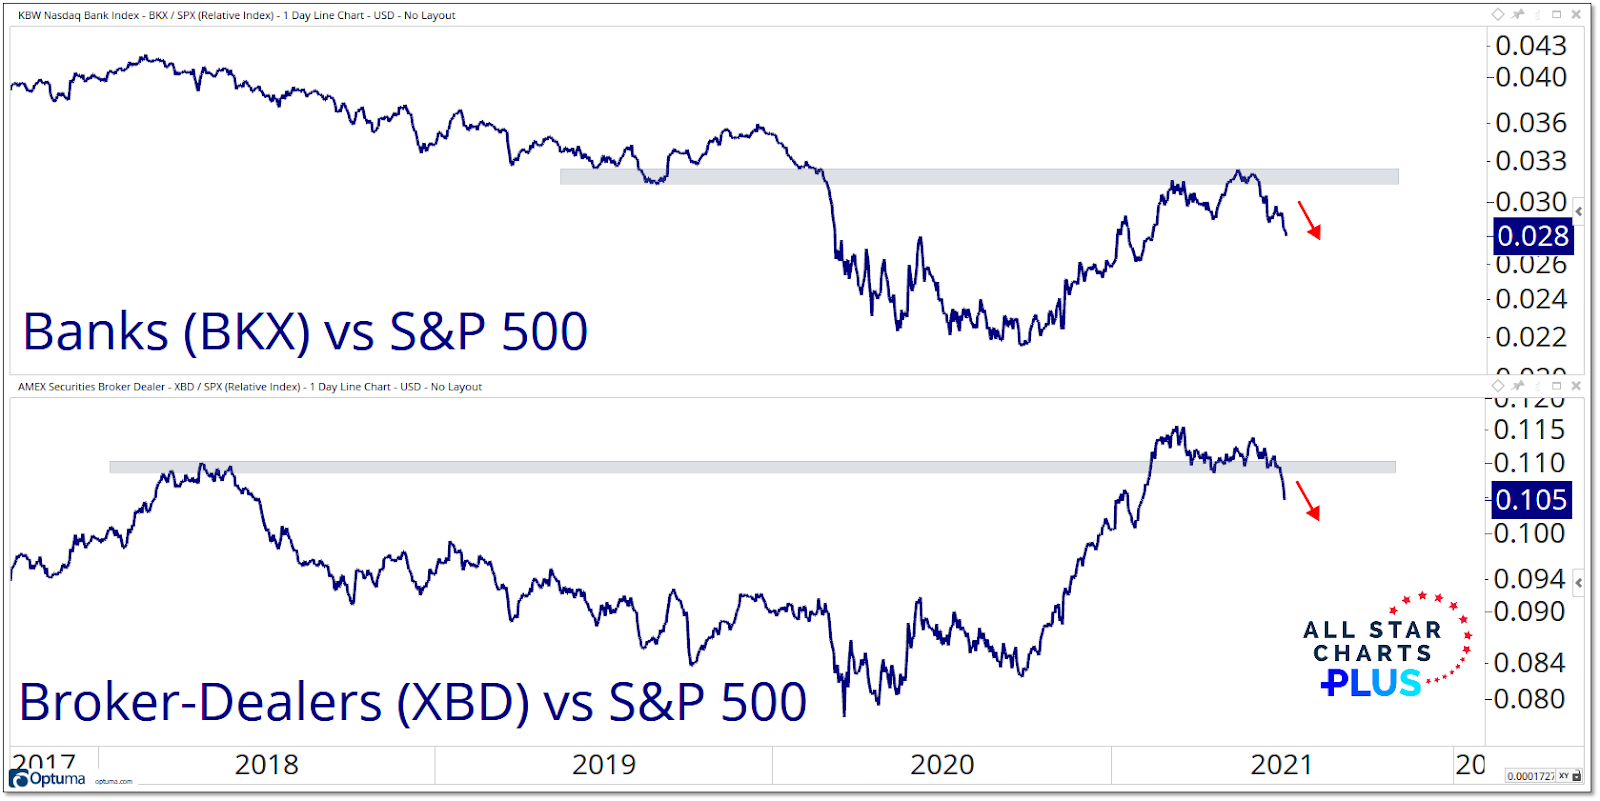
I might be old school, but I like to look within the Financials sector for leadership trends that provide some clues for the path of the market overall. Specifically, I keep an eye on what Banks and Broker/Dealers are doing on an absolute basis but also relative to the S&P 500. The XBD bottomed versus the S&P 500 early last year and led the rally into Q1 2021. The BKX began leading a bit later, but its relative strength carried further into this year. Both now have rolled over and are moving lower versus the S&P 500. As we have shown recently, the XBD/SPX ratio tends to move with our risk on/risk off ratio and so a breakdown in the Broker/Dealer index may be a warning signal about the overall risk backdrop.
This is the video recording of the July 8th Town Hall Meeting w/ Willie Delwiche & JC Parets
07/08/21 2PM ET [Read more…]
From the desk of Willie Delwiche.
You guys need to come see this…
That’s what an excited neighbor told us after randomly knocking on our front door earlier this week.
We followed her out to our yard by the sidewalk to find a trio of scientists readying to catch and study a pair of Cooper’s Hawks that have been nesting in a tree across the street. They constructed a trap with a net stretched between a couple of poles and a distress call playing over a loudspeaker.
First, the female swooped in, followed by the male. The hawks were quickly entangled in the net and the scientists began to band and measure them.

From the desk of Willie Delwiche.
Key takeaway: Record highs in equity indexes buoy investor sentiment that has remained optimistic without a significant challenge over the past year. Bulls ticked higher across our sentiment indicators last week, yet we still see evidence that risk appetite is turning (NAAIM Exposure Index, NASDAQ trading volume, overall levels of options activity). These new highs and levels of optimism must contend with the undercurrents of lackluster breadth measures and an absence of pessimism. Risks lie just beneath the surface. This raises the possibility of a more complete sentiment unwind when risks are realized and prices begin to falter.
Sentiment Report Chart of the Week: Know What They Say, Watch What They Do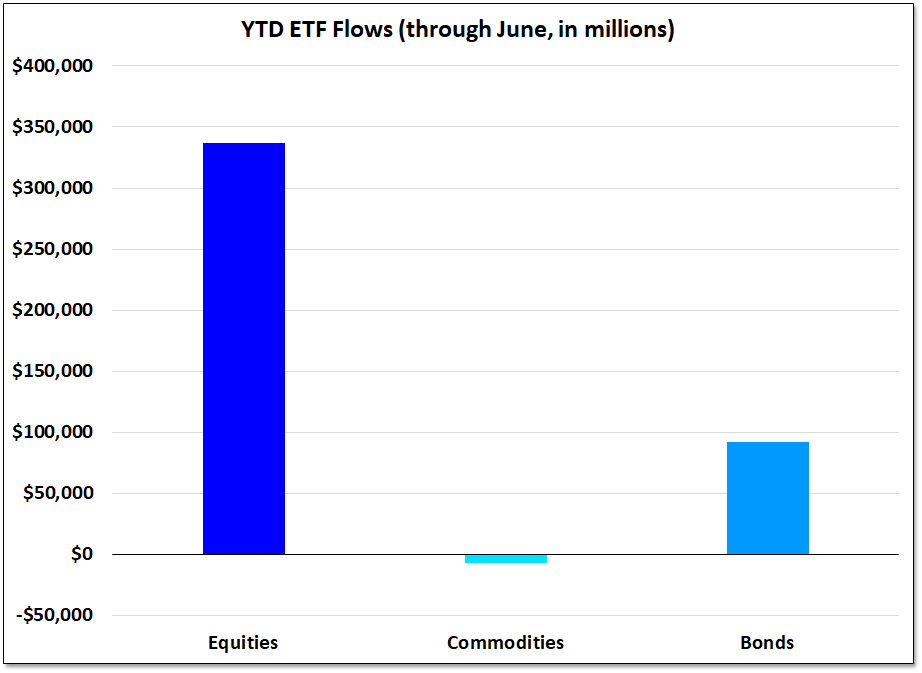
One of the best ways to measure actual sentiment is to watch what investors are doing with their money. Through the first six months of the year, equity ETF inflows totaled nearly $350 billion, with inflows to bond ETFs falling shy of $100 billion. Commodity ETFs have seen outflows on a YTD basis.
The latest All Star Charts “Follow The Flow” report is out, and once again there’s a great looking opportunity there that caught my eye.
In a nutshell, the Flow report is looking at “a list of stocks that large financial institutions are putting big money behind (via options)… and they’re doing so for one reason only: Because they think the stock is about to move in their direction and make them a pretty penny.”
The opportunity setting up now is in a stock in a sexy sector that looks like it’s ready to resume the rocketship ride it embarked on in 2020.


