This is the video recording of our August 1st Monthly Charts Live Strategy Session
[PLUS] Weekly Sentiment Report
From the desk of Willie Delwiche.
Key Takeaway: In recent weeks, the bulls have made their presence known after hiding in the shadows for most of the year. But as they inch their way forward, they will need assurance from the market that they’re moving in the right direction. So far, any signs of positive feedback have been lacking. New lows remain greater than new highs (for 35 weeks and counting). And there is an absence of strength among global markets, although they have stopped going down. The market needs to turn it up in regards to price and participation if the bulls are to prove more than a bunch of wallflowers.
Sentiment Report Chart of the Week: How Do We Keep The Bulls On Dance Floor?
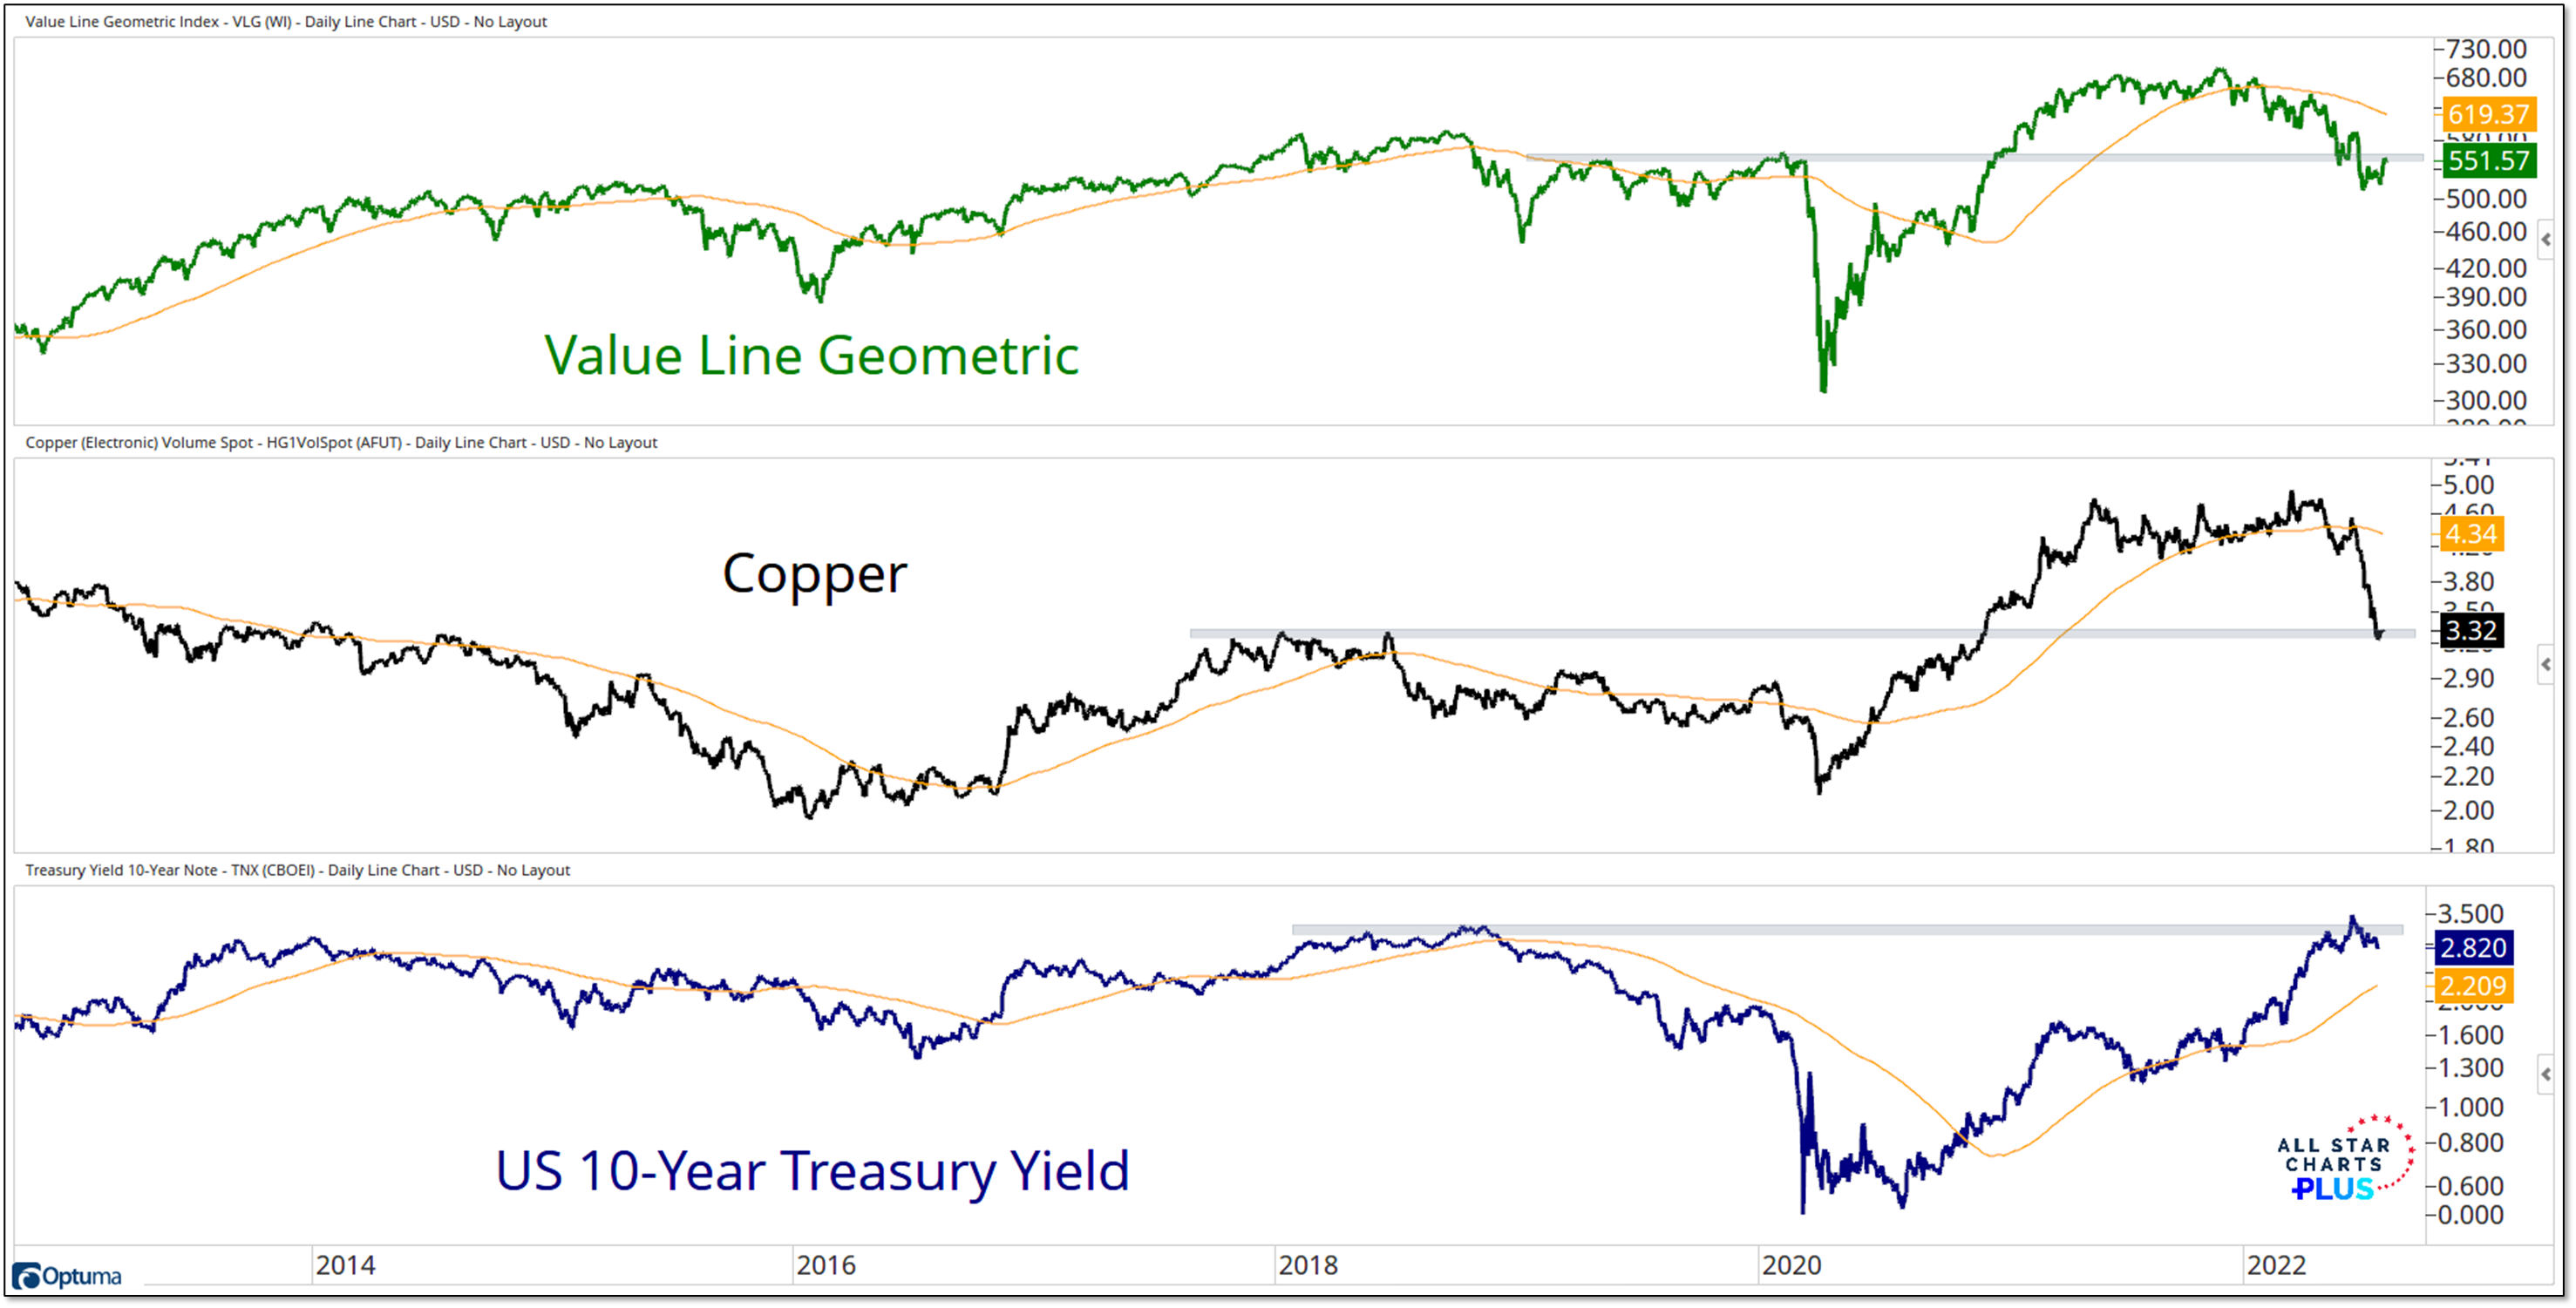
If we are going to have a party, we need to keep bulls on the dance floor. One way to do that is through improved price action. We know that it takes bulls to have a bull market, but it also takes a bull market to keep the bulls involved. When we look across various assets, we keep coming back to key levels from 2018. The Value Line Geometric Index is struggling to get back above its pre-COVID highs, copper is finding support at its 2018 highs and Treasury yields briefly poked above their 2018 highs before reversing lower. Not sure whether it will be above or below, but I expect all three of these to end up on the same side of those key thresholds. If it’s above, equity bulls are being rewarded and they are likely to keep dancing. If it’s below, then it’s back to enduring taunts from bears and wondering why they bothered showing up in the first place.
Panic Buying Ensues
July Mid-Month Conference Call: 5 Key Takeaways
From the desk of Steve Strazza @Sstrazza
Monday night we held our July Mid-Month Conference Call, which ASC Premium Members can review here.
In this post, we’ll summarize the call by highlighting five of the most important charts and/or themes we covered, along with commentary on each.
Let’s get right into it!
[PLUS] Weekly Sentiment Report
From the desk of Willie Delwiche.
Key Takeaway: It’s been bears on parade all year, starting with significantly less optimism coming into this year than was seen at the beginning of 2021 or 2020 and continuing through lengthy stretches of more bears than bulls on both the II and AAII surveys. Persistent pessimism among advisory services has now been broken and it’s time for the bulls to show what they’ve got left in their tank. The clock is ticking, though, as they’ve used so much of their limited firepower and yet we continue to see more stocks making new 52-week lows than 52-week highs. Bulls have put together two days of better than nine-to-one upside volume (on July 15 and again on July 19). That checks off one box (out of five) on our bull market re-birth checklist, but there is more work to be done before concluding that any uptick in optimism is well-placed.
Sentiment Report Chart of the Week: Recession Fears Misplaced?
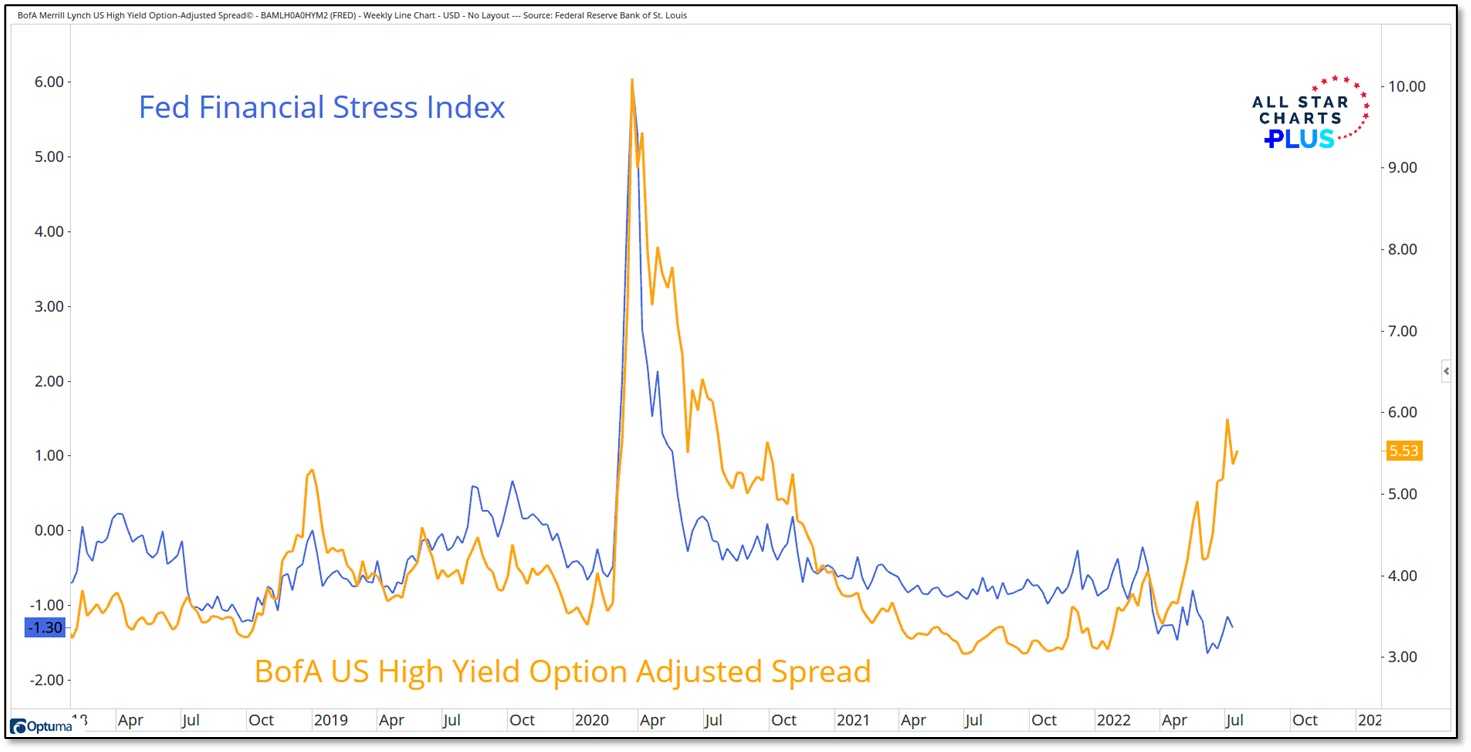
High yield spreads moving higher tends to be a reliable sign that liquidity conditions are deteriorating and economic prospects are worsening. This usually means more stress in the financial system. There is plenty of evidence of that in the current situation as incoming data shows activity is cooling rapidly and conditions that are consistent with (or may lead to) recession are more widespread. Pushing back against all that is the Fed’s Financial Stress Index, which is actually below where it was when the Fed began raising rates in March. It may be that the Fed’s index moves more slowly than some of the other indicators (like high yield spreads) or it could also be that the fear reflected in widening yield spreads (and the inversion between 2-year and 10-year Treasury yields) is misplaced. The burden of proof is on the bulls to prove that it is the later and not the former.
[Premium] Mid-Month Conference Call Video Recording July 2022
Chart of the Day: Thrust Hunting Season
[PLUS] Weekly Sentiment Report
From the desk of Willie Delwiche.
Key Takeaway: Flow data showing equities attracting 71 cents of every ETF dollar in the first half of 2022 casts some doubt on claims that sentiment is washed out even as bears continue to outnumber bulls. New lows > new highs and excessive pessimism are features of bear markets, while new highs > new lows and building optimism tend to be seen in bull markets. The wall of worry seen in the AAII sentiment data off of the COVID lows is more an exception than it is a rule, especially in the absence of breadth thrusts or other evidence of strong participation. Between the ETF flow data and measures of household asset allocations, the risk is that the investor love affair with equities grows cold and they seek solace elsewhere. Overall the sentiment data now looks more similar to what was seen in Q1 2008 than what was seen at the lows a year later.
Sentiment Report Chart of the Week: Equities Feel The Flow
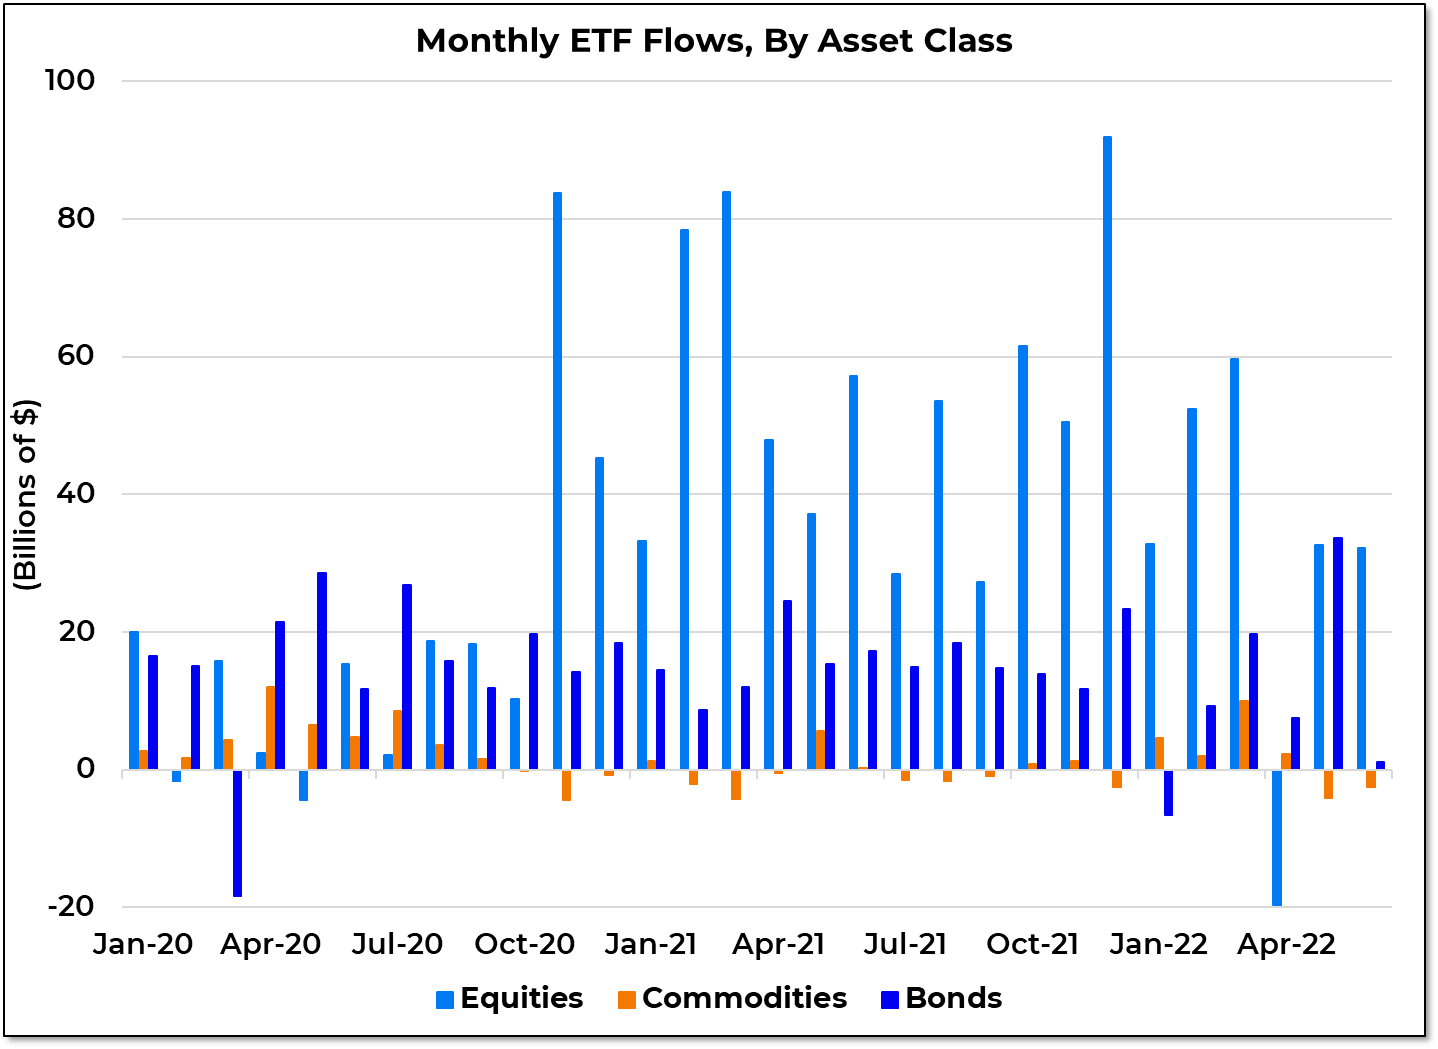
Discussions of sentiment often focus only on what investors say and not what they do. Usually this does not matter much. This is not one of those times. Later in this week’s report we take a closer look at the discrepancy between AAII data that shows how investors feel versus how they are positioned. But we can start with this. For all the talk about rampant pessimism, investors have kept buying stocks. Equity ETF’s pulled in another $32 billion in inflows in June, bringing the YTD total to $189 billion. Despite one of the most challenging beginnings to a year, there was only a single month of outflows. Equities attracted 71 cents of every dollar that flowed in ETFs in the first half of 2022. That is slightly slower than the 78 cents per dollar that equities attracted in 2021, but well above the 50 cents per dollar of inflows that went to equities in 2020.
- « Previous Page
- 1
- …
- 10
- 11
- 12
- 13
- 14
- …
- 25
- Next Page »


