This is the video recording of our July 2nd Monthly Charts Live Strategy Session
[PLUS] Weekly Sentiment Report
From the desk of Willie Delwiche.
Key Takeaway: With pessimism at levels that elicit comparisons to the financial crisis, conditions are set for a meaningful bounce in equities. But at this point, the similarities appear closer to what prevailed in the first half of 2008 than what was seen as stocks moved toward their final lows in March 2009. With the NYSE and NASDAQ still seeing more new lows than new highs (31 weeks and counting) and breadth thrusts conspicuously absent, the backdrop offers little about which to get excited. Recent leaders are experiencing newfound weakness and new leaders are more defensive in nature. Investors have endured a succession of failed rallies in recent months, but that patience may wear thin. The burden of proof is on the bulls. Rally attempts that increase hope but offer little strength would fit the pattern seen during the financial crisis
Sentiment Report Chart of the Week: Mixed Messages From Bonds
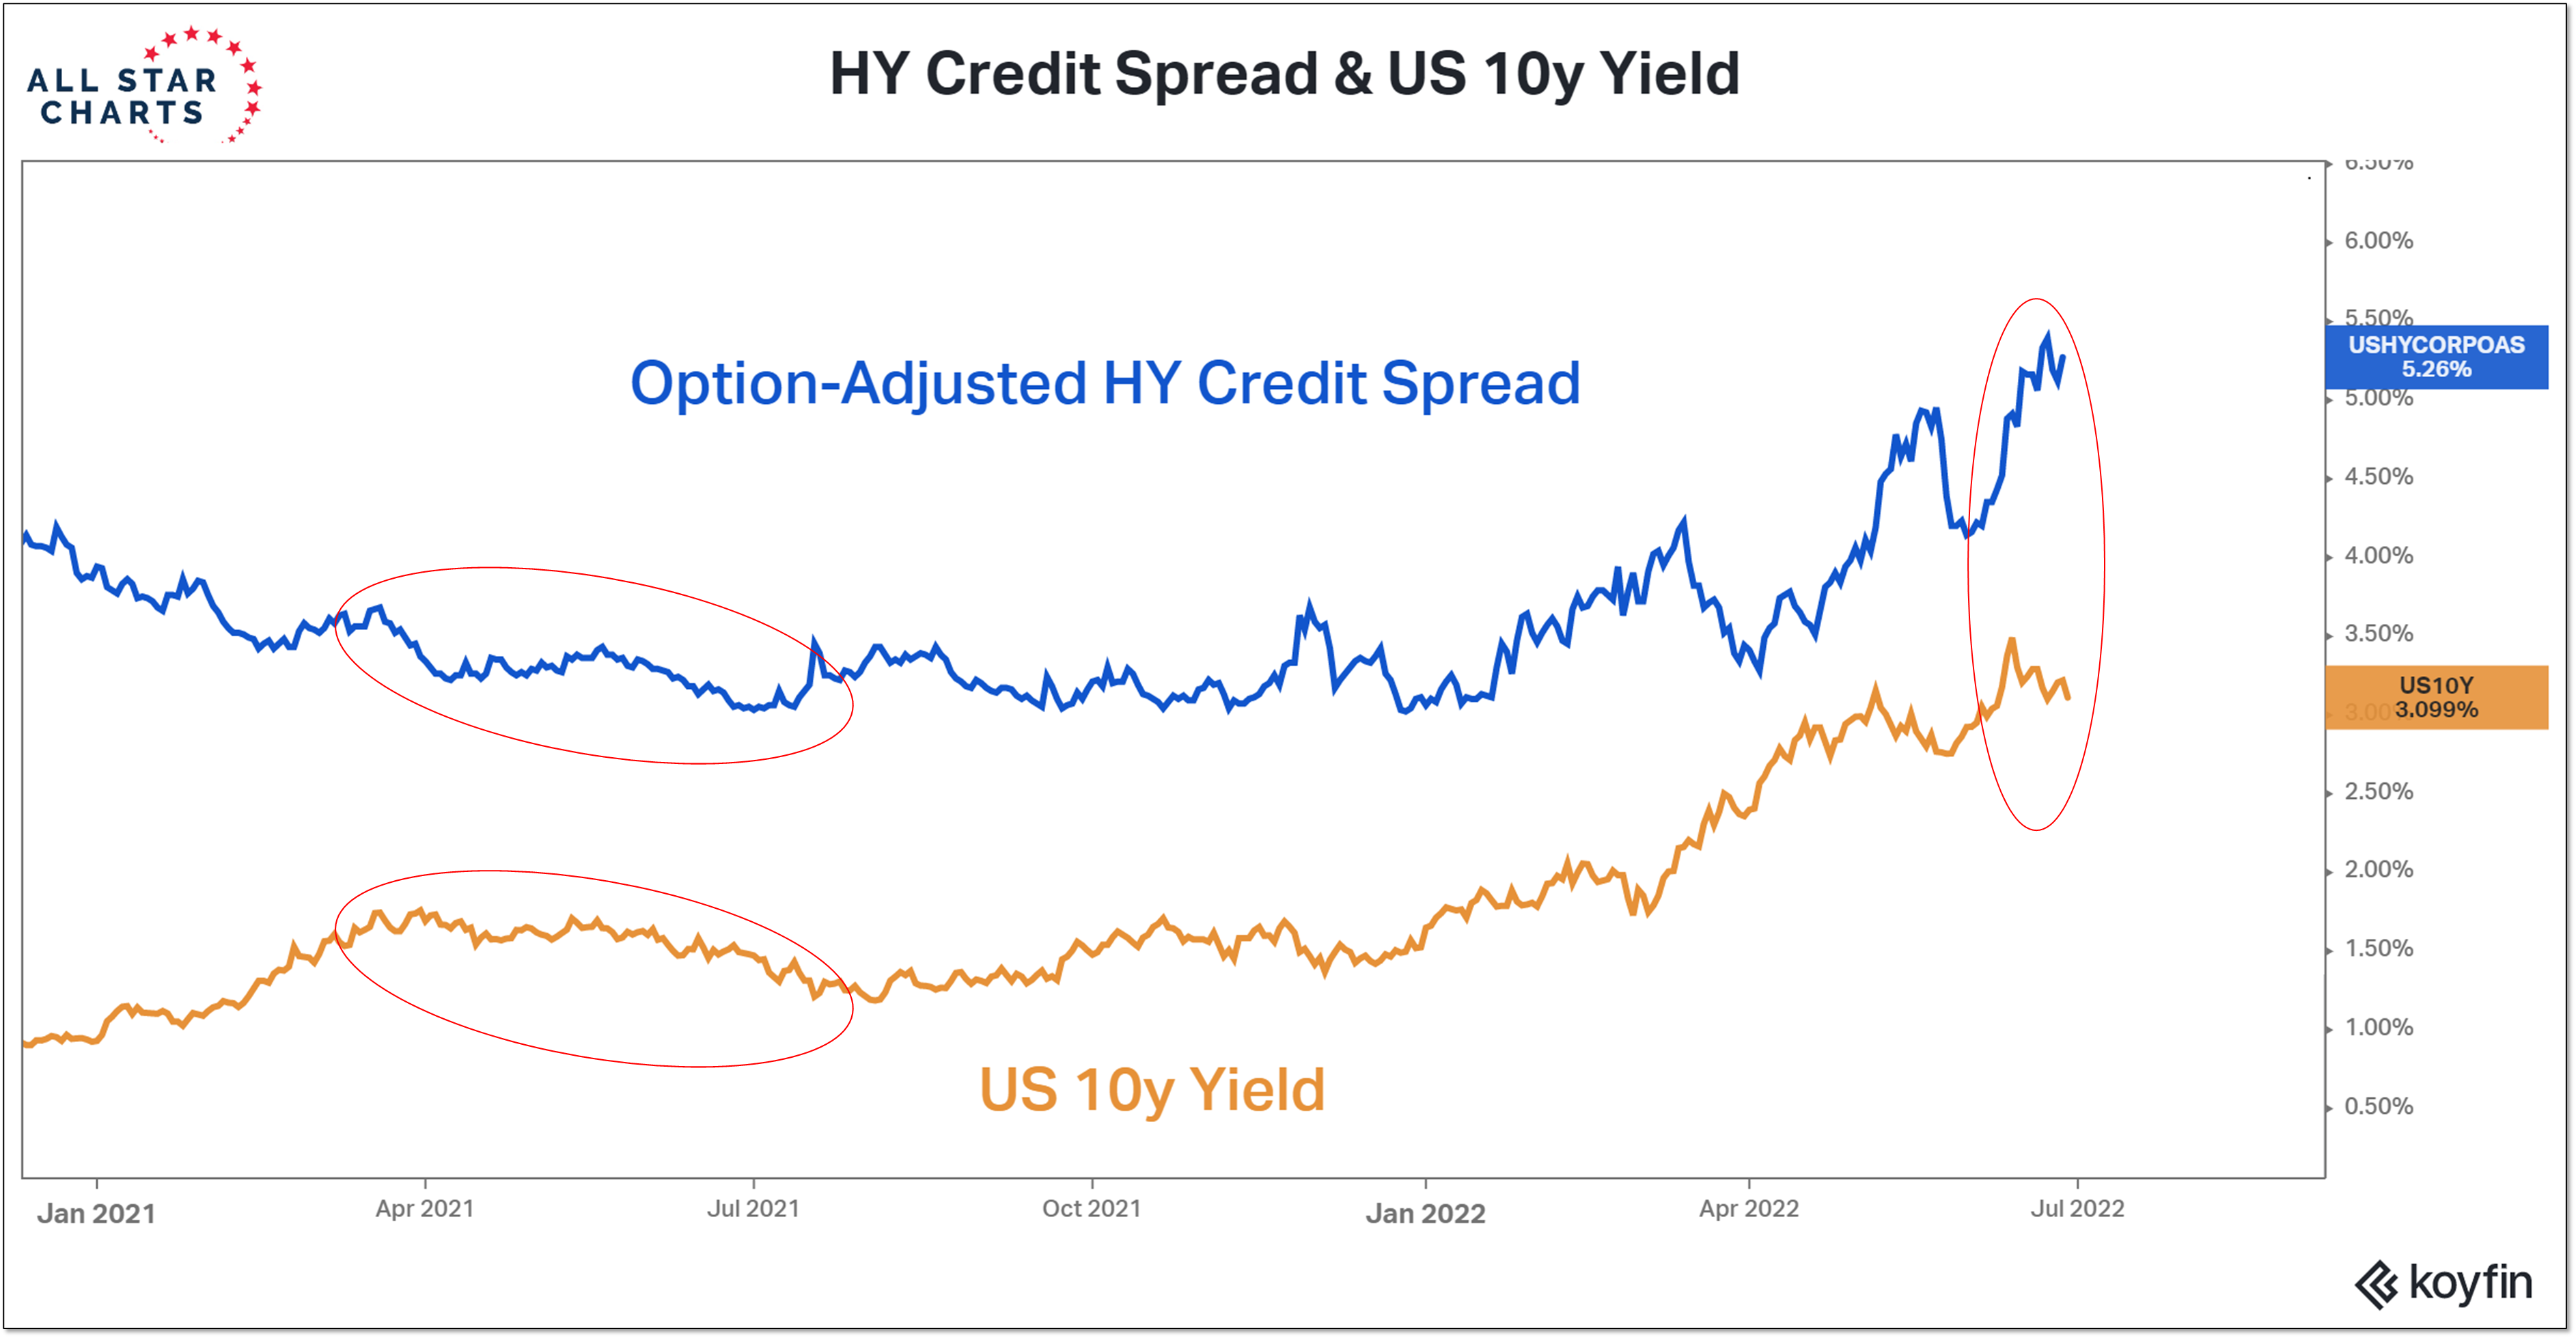
It’s been a rough first half for bonds. For now at least, Treasury yields have stopped crashing. When Treasury yields stopped rising and started to move lower in the first half of 2021, investor moods improved and risk appetites increased. Back then, however, lower Treasury yields were accompanied by narrowing credit spreads. Now, while Treasury yields have pulled back from their highest levels in over a decade, High Yield spreads are climbing to levels not seen since the COVID crisis. Junk bond ETF’s are trading at their lowest levels in more than two years. In this scenario, lower Treasury yields might not be a green light for growth areas of the market, but a move to safety that could include a re-evaluation of overall equity exposure (of which households have historically high levels) and/or an increased preference for defensive areas of the market.
[PLUS] Weekly Sentiment Report
From the desk of Willie Delwiche.
Key Takeaway: More and more distribution patterns are resolving lower as bearish price action runs rampant across all major assets classes. Even the leadership groups such as commodities experience selling pressure as pessimism grows. Yet, while investors have expressed concern, they have not done much about it. Equity funds continue to attract inflows ($200+ billion YTD, according to DB) and households are hardly flush with liquidity. Perhaps it will take a second quarter in a row of being told not to look at their retirement account statements to prompt some investor action.
Sentiment Report Chart of the Week: Copper Looks Tarnished
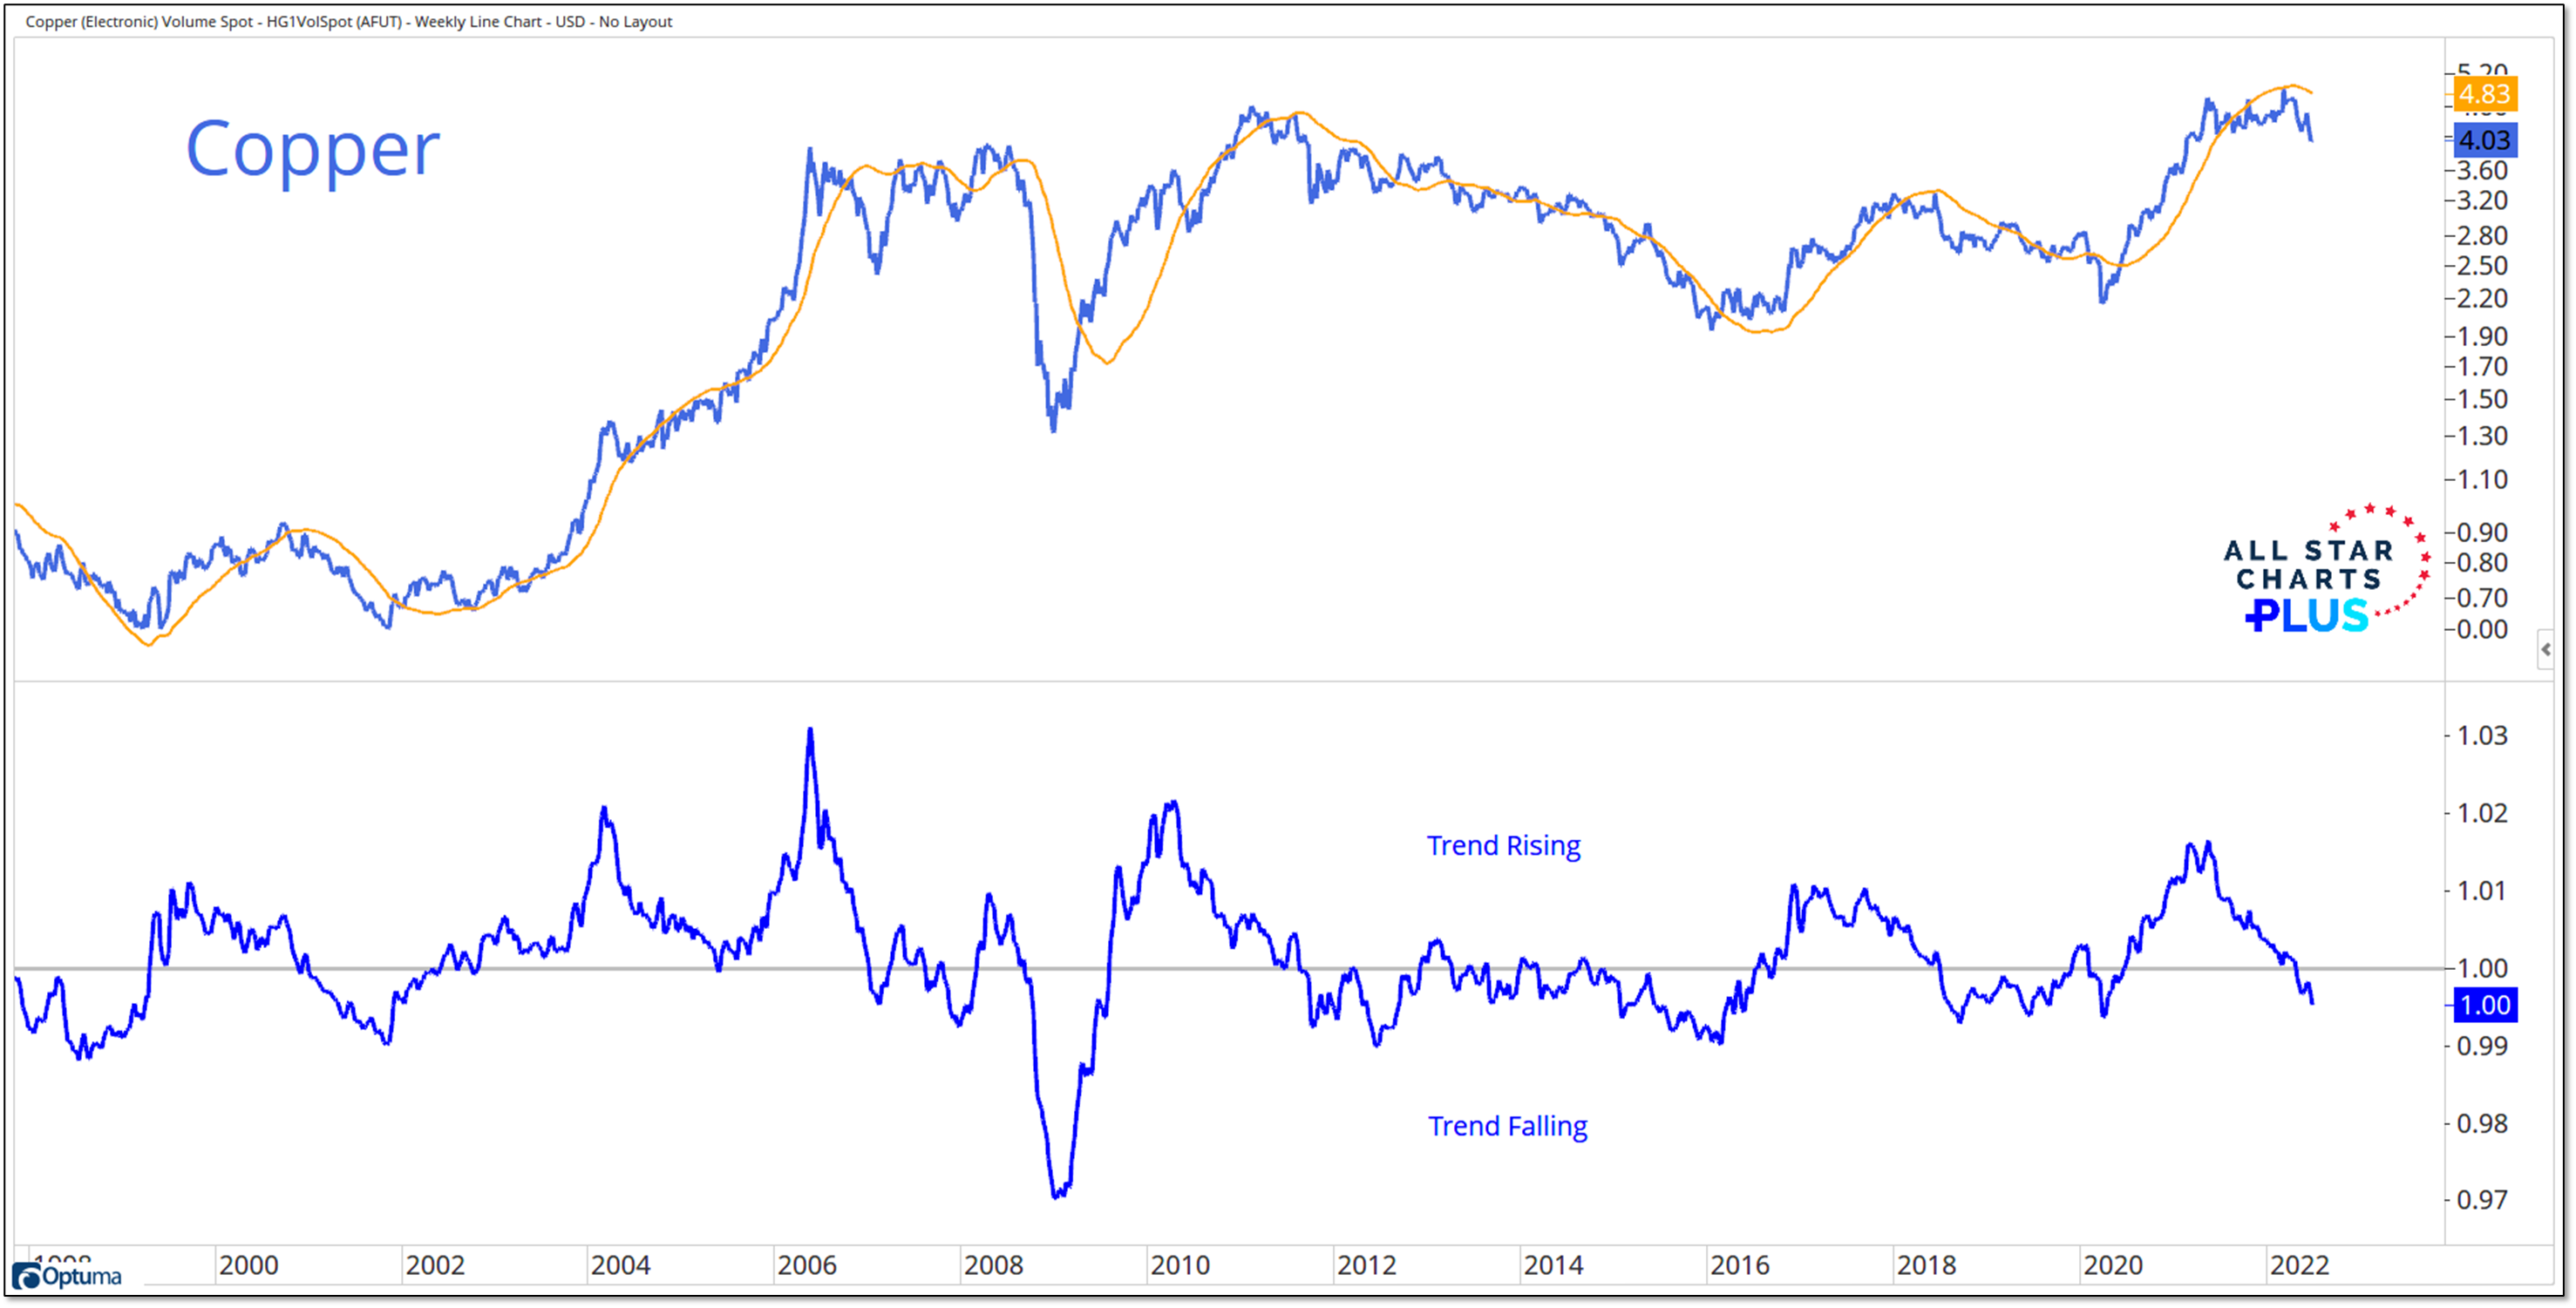
Some call it Dr. Copper – the commodity with a PhD in economics. For me, it’s more like Mr. Copper, CMT – Emerging Market technical analyst. Either way, market participants express how they are feeling through the price of copper. Copper was an early leader off of the COVID lows but has moved sideways since early 2021. Now, our trend indicator has rolled over and with Copper dropping below 4.00, a lengthy consolidation is resolving lower. These price and trend developments suggest that the pessimism showing up in the sentiment indicators may be justified for now.
[PLUS] Weekly Sentiment Report
From the desk of Willie Delwiche.
Key Takeaway: Lower prices have a way of souring investor moods. It’s a relationship that thrives on the feedback loop it creates. Increased selling pressure begets pessimism that fuels continued selling pressure. With the recent relief rally behind us, short-lived optimism has dissipated and bearish sentiment is on the rise (II bull-bear spread challenges its lowest level since the GFC and Consensus bulls fall to their lowest reading since the Covid crash). It’s hard to claim sentiment is washed out as long as pessimism is still expanding. And based on the disparity between investor moods and positioning, there’s still plenty of gas in the tank for the bears.
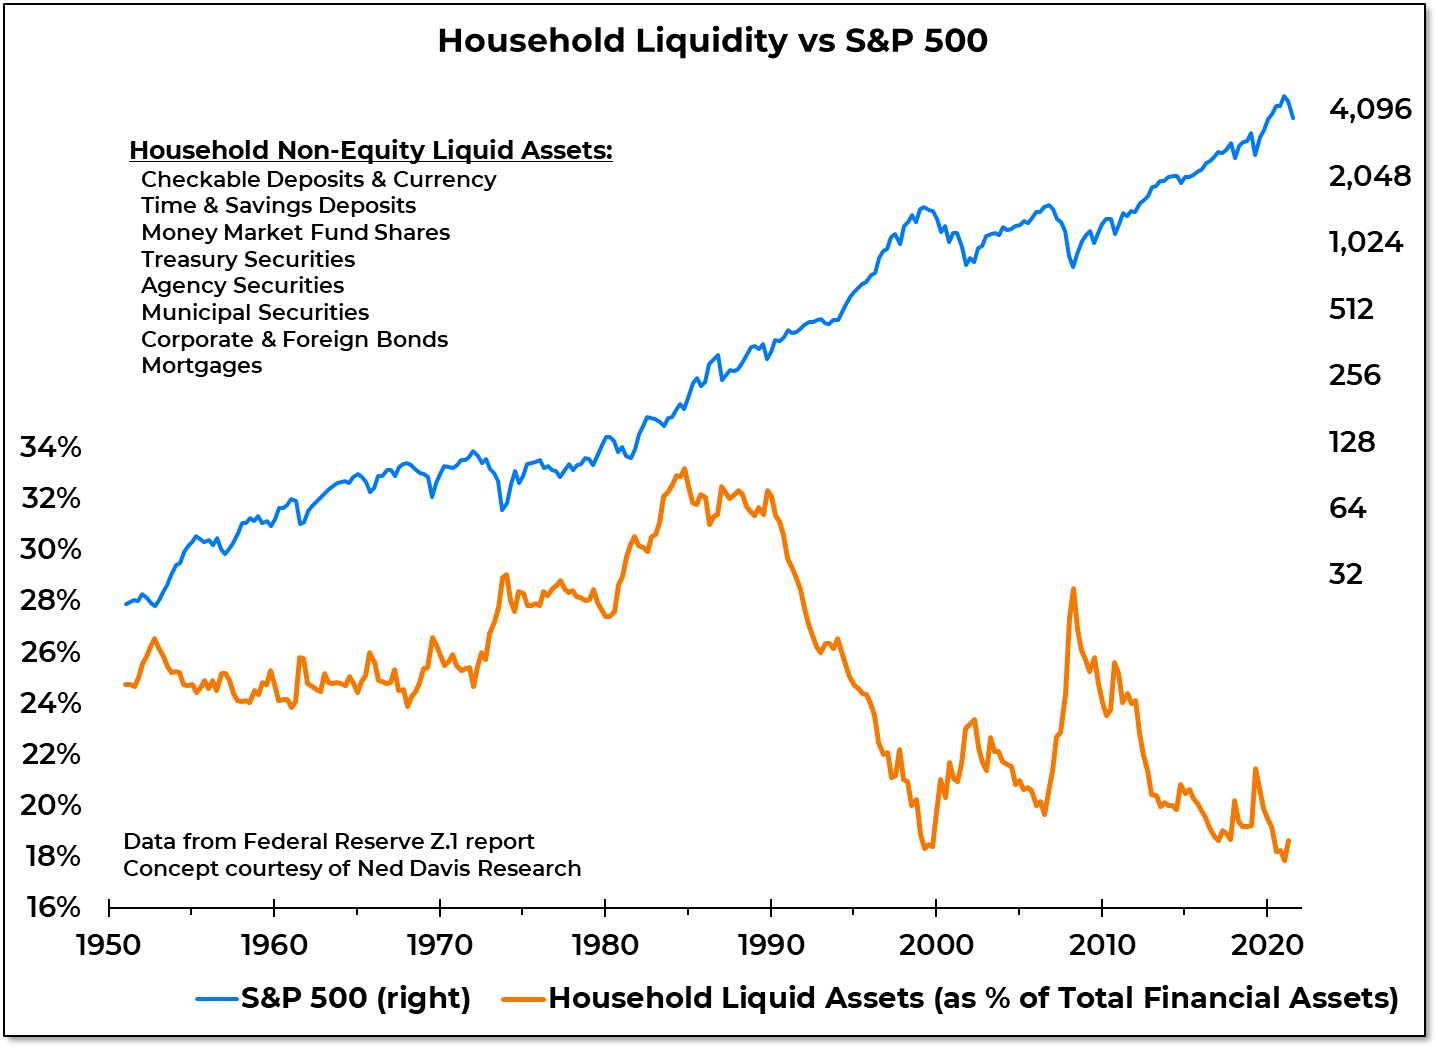
Sentiment Report Chart of the Week: Household Liquidity Near Historic Lows
The Fed’s latest report on the Financial Accounts of the US (otherwise known as the Z.1) shows that household liquid assets increased by slightly more than 2% in the first quarter. Compared to total financial assets (which were down nearly 2% in the quarter), household liquidity improved slightly. Household non-equity liquid assets rose from 17.9% of total financial assets in Q4 2021 to 18.6% in Q1 2022. That Q4 2021 level was the lowest on record and the only times in history that it has been lower than it was in Q1 were 2021 and 2000. In other words, even with the slight uptick, household liquidity remains near historic lows. Despite what the sentiment surveys say, households remain heavily exposed to equities and have not moved to the sidelines in a meaningful way. With the news now out that stocks are in a bear market and likely to face continued pressure from rising rates and deteriorating economic conditions, the risk is that households will seek to improve their liquidity position by reducing equity exposure. The last time liquidity was this poor (2000) it took nearly a decade of sideways market action until the liquidity rebuild was complete.
[PLUS] Weekly Sentiment Report
From the desk of Willie Delwiche.
Key Takeaway: There is plenty of talk about investors turning fearful. This is reflected in more bears than bulls on the various sentiment surveys and high demand for puts relative to calls (though this is being distorted by the collapse in call option activity). But from a longer-term perspective, risks to the equity market remain elevated. Stocks are still historically expensive and overowned. Updated data from the Fed this week will clarify how (if at all) the household asset allocation mix shifted in Q1 after finishing 2021 with the highest exposure to stocks versus bonds in history. While the cyclical rise in pessimism may provide enough fuel for bounce attempts and counter-trend rallies, it will be difficult to suggest that a major reset has occurred until stocks are inexpensive and underowned in addition to being unloved.
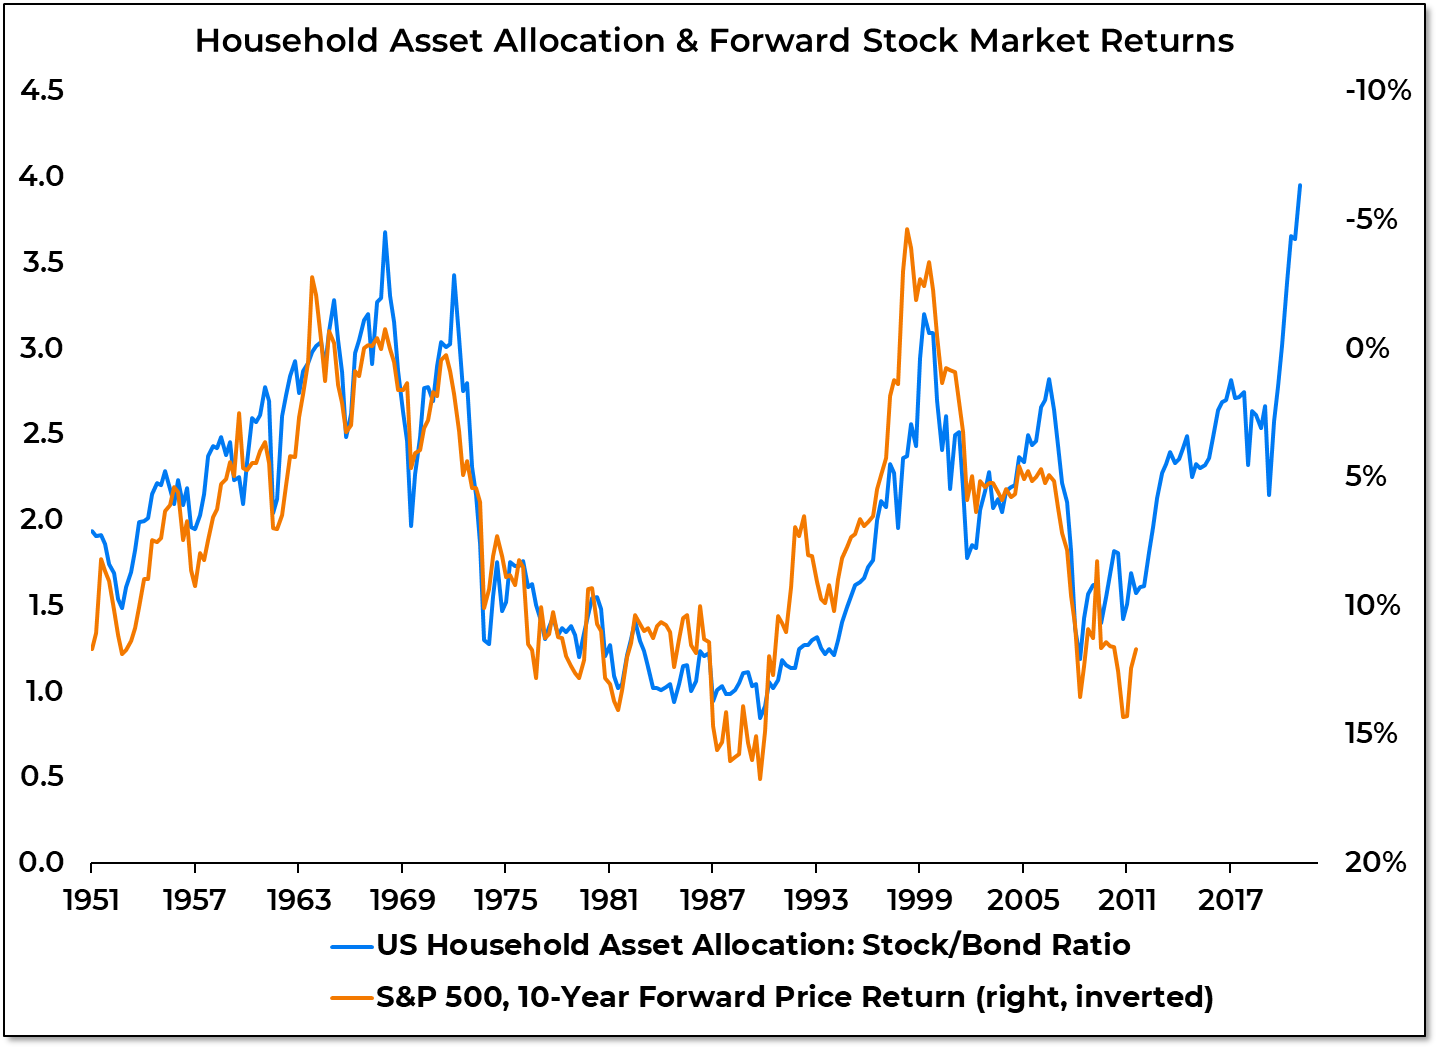
Sentiment Report Chart of the Week: Equity Exposure Charts A Challenging Path
The Federal Reserve report from which we get the data behind US household asset allocation comes out quarterly, and with a lag. We will finally get Q1 2022 data this week. While quarter-to-quarter shifts are interesting, this data is more about identifying the longer-term environment for equities than anything else. The data shows that historically there has been a strong inverse correlation between exposure to stocks (relative to bonds) and forward returns for the S&P 500. In the past, when households have had heavy exposure to stocks (like they did in 1968 and 2000), the following decade has produced little by way of returns. Periods of relatively light exposure to stocks (like 1991 and 2009) were followed by some of the best 10-year returns in the stock market’s history. When we look back 10 years ago from today, the stock/bond ratio was still low in Q1 2012 (48% stocks, 28% bonds) but beginning to rise. It reached its highest level ever in Q4 of last year (62% stocks, 16% bonds). If the historical pattern holds, S&P 500 returns over the coming decade could fall quite a bit short of what has been experienced over the past decade.
[PLUS] Weekly Sentiment Report
From the desk of Willie Delwiche.
Key Takeaway: Investor moods will change as prices fluctuate but they seemed to follow word with deed in May. The AAII asset allocation survey showed them lightening up (perhaps only briefly and modestly) on their equity exposure. By month-end, we had evidence that the $4.5 trillion in money market funds (more of a molehill than a mountain when adjusted for total market value) was being put to work in both stocks and bonds. Bearish investors are not so much disgruntled with stocks, but disgusted by the price action they have experienced this year. It didn’t take much of a move off the lows for optimism to start building again. Rallies that are initially despised (or at least viewed skeptically) are more likely to have staying power than those that are quickly embraced. Sentiment is at levels from which rallies tend to emerge – positioning, however, is not.
Sentiment Report Chart of the Week: Investors Take Some Action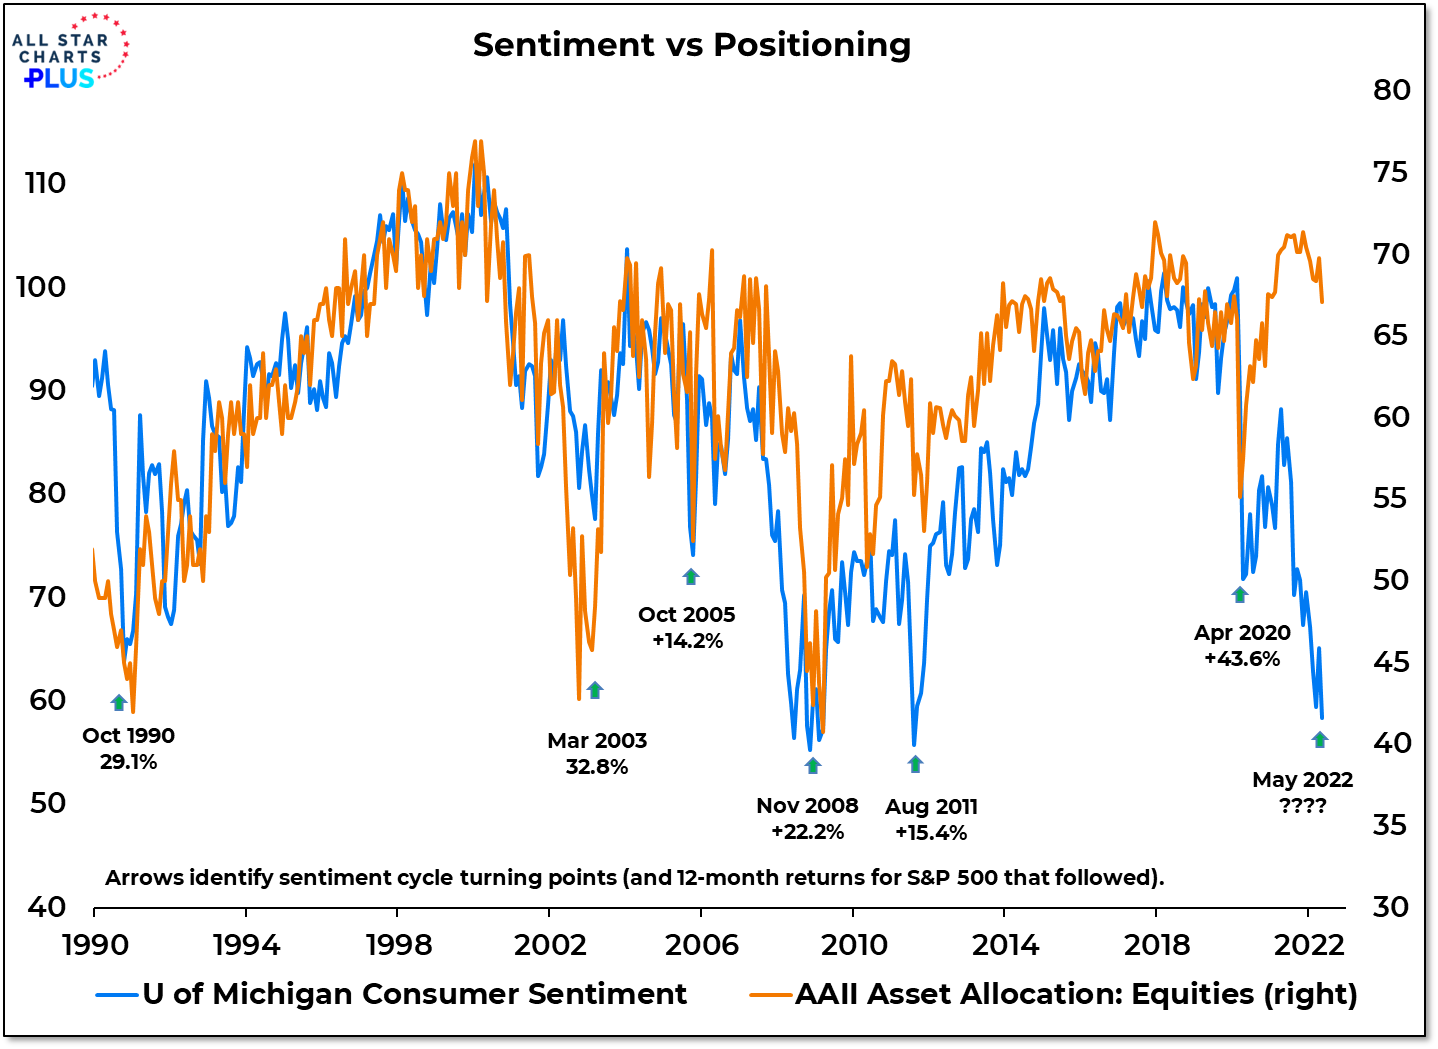
AAII asset allocation data shows that investors trimmed their equity exposure last month. pulling back from 70% in April to 67% in May. Bond exposure moved up from 13% to 14% and cash increased to 19%. Two things are worth pointing out here:
- This data is collected over the course of the month and heavy inflows into both equities and bonds over the past two weeks could indicate that the little that had been moved to the sidelines has already been put back to work.
- Even with the reduction in equity exposure, there is a wide chasm between what investors are saying (represented by the Consumer Index) and what they are doing (AAII Asset Allocation). The Consumer Sentiment index dropped to its lowest level in a decade in May, equity exposure dropped to its lowest level late 2020. At the important sentiment turning points of the past (highlighted on the chart above), equity exposure averaged just 50%.
[PLUS] Weekly Sentiment Report
From the desk of Willie Delwiche.
Key Takeaway: Fear and concern are at the tip of every investor’s tongue, yet their eyes remain on the market. For all the pessimism suggested by sentiment surveys, there’s still a great deal of hope as the desperate search for the bottom continues. Yes, put call ratios are on the rise but that’s mostly driven by falling call activity as last year’s speculative exuberance evaporates. Also, investors continue to favor equities over more defensive assets such as bonds and cash despite what they say. Caution remains warranted until attitudes change or market participants are forced to avert their gaze out of disgust. After we see evidence of improved price action (and likely a series of breadth thrusts), accumulated pessimism becomes fuel for a rally, but the timing of that turn is anybody’s guess at this point.
Sentiment Report Chart of the Week: Contrarian Positioning Is To Go Long Bonds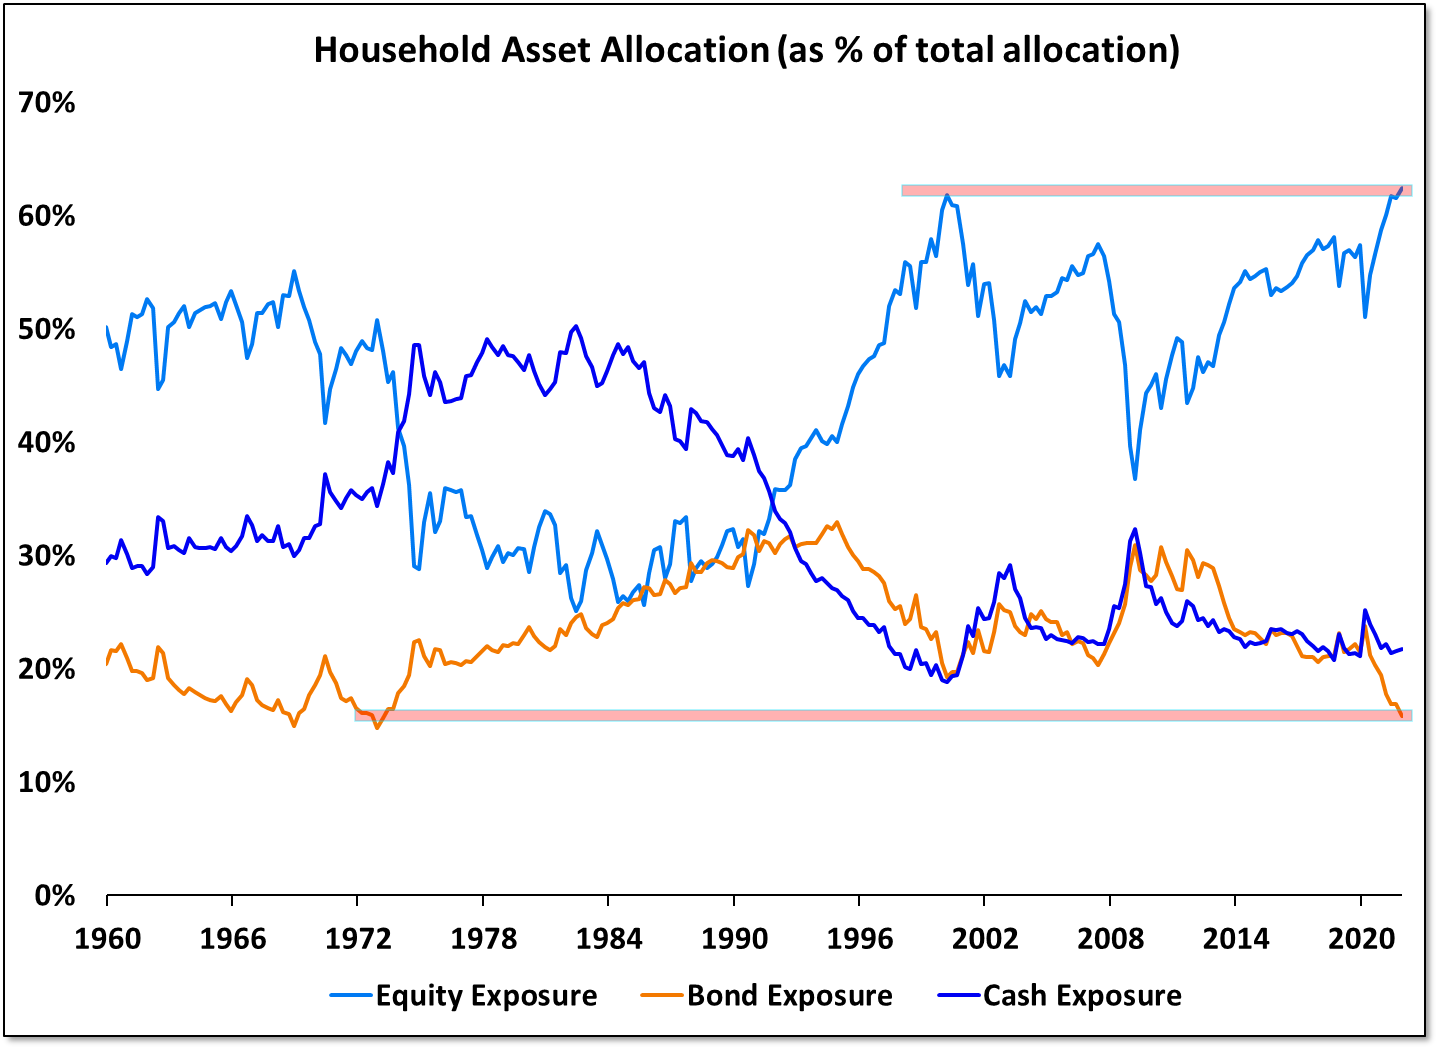
With all the focus on sentiment indicators, it seems like being a contrarian right now is all the rage. The problem with this approach is that while investors say they are pessimistic about stocks (and the economy), their positioning tells a different story. Household equity exposure was at an all-time high coming into 2021 and despite weakness in stocks this year, equity ETF’s have continued to see inflows. Even target date funds (a popular choice for passive investors) have been increasing equity exposure in recent years. It’s a different story for bonds. As dark as the mood has been on equities, it’s been even worse for fixed income and this sentiment is actually reflected in positioning. Coming into this year, household exposure to bonds was its lowest since the early 1970’s. With yields having risen to and now pulling back from well-tested resistance as concerns about economic deterioration rise, the contrarian call might not have anything to do with stocks. It might be to go long bonds.
[Premium] Mid-Month Conference Call Video Recording May 2022
- « Previous Page
- 1
- …
- 11
- 12
- 13
- 14
- 15
- …
- 25
- Next Page »


