This is the video recording of our December 1, 2021 Monthly Charts Live Strategy Session
[PLUS] Weekly Sentiment Report
From the desk of Willie Delwiche.
Key Takeaway: The bulls came out expecting strength but were served a healthy dose of volatility. What on paper is a historically favorable season has turned out to be quite the opposite. New highs quickly fell to the wayside and into the rearview mirror as participation crumbled beneath the surface. In the wake, investor optimism is now accompanied by a sobering caution. The need for repair beneath the surfaces is great for both domestic and international equities, and is necessary to re-build investor confidence. For now, there are no significant signs of pessimism emerging. But volatility and pessimism can be dangerous dancing partners, each leading the other to the edge of the dance floor.
Sentiment Report Chart of the Week: Investors’ Love Of Equities Undiminished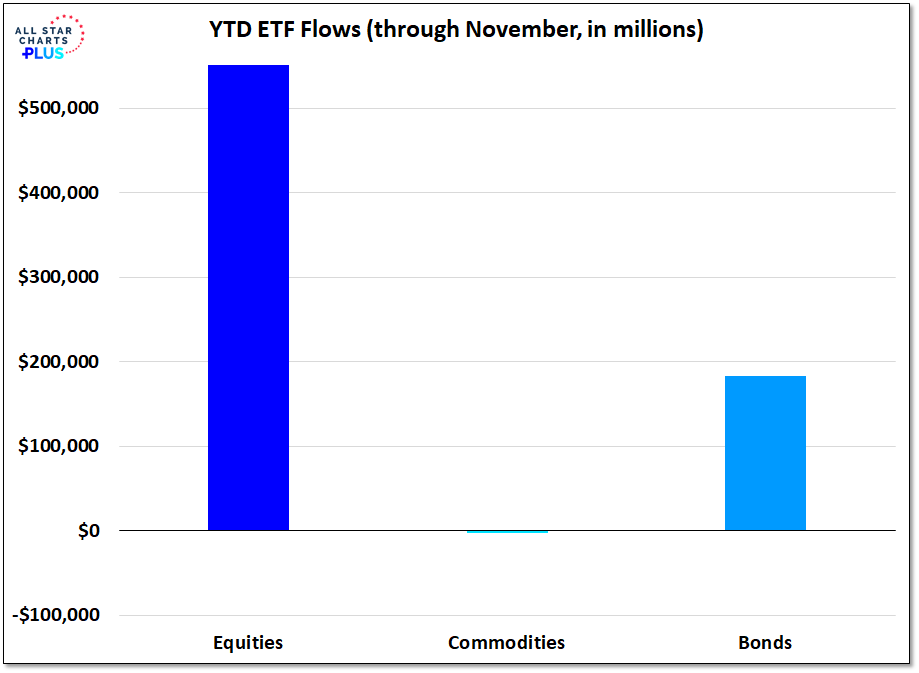
Investors continue to pile into equities. YTD ETF flows through November show equity funds attracting nearly $600 billion of inflows, with two-thirds of this heading toward US equities. Bond fund inflows are just shy of $200 billion. Commodities remain relatively unloved, seeing outflows on a YTD basis but actually recording modest inflows for the month of November.
[PLUS] Weekly Sentiment Report
From the desk of Willie Delwiche.
Key Takeaway: A healthy level of optimism ushers investors into the holiday season. But lofty expectations are neither reflected in price nor supported by breadth. Participation is struggling to expand beneath the surface and cyclical areas of the market are retesting critical levels of support. A narrow rally running on empty leaves the market vulnerable to disappointment and could challenge high spirits. The question becomes how patient will investors be, especially since consumer sentiment is in the dumps. If the fish aren’t biting, some may prefer to cut bait.
Sentiment Report Chart of the Week: Consumers Are Cranky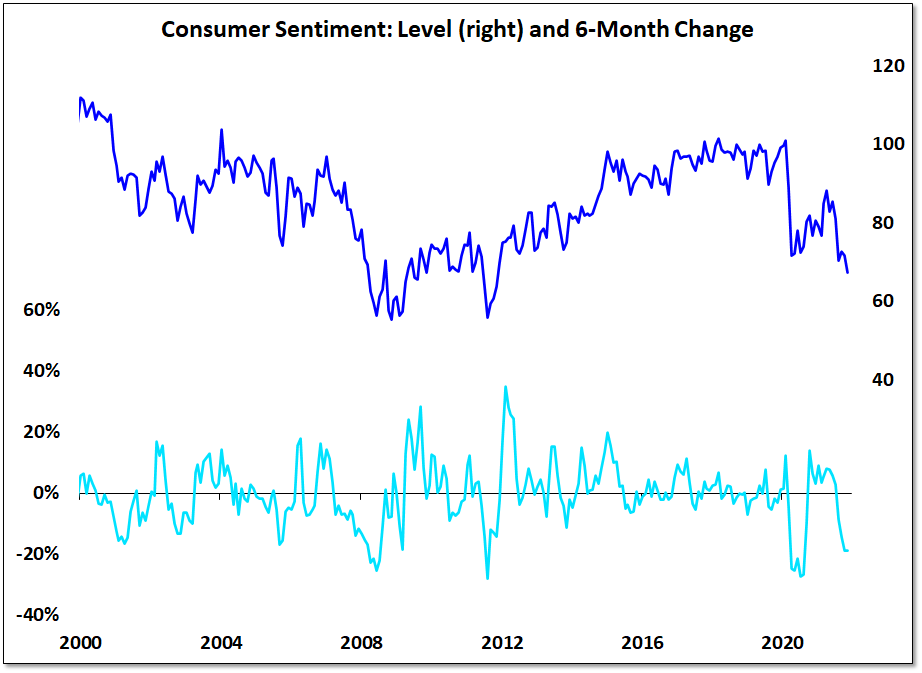
The latest data from the University of Michigan shows consumers are in a pretty bad mood. The Consumer Sentiment Index for November is at its lowest level in a decade. While the expansion in the number of stocks hitting new lows probably doesn’t help, this seems to reflect political divisions and partisan divides more than than an actual economic or market reality. Too often we let the headlines and news stories from afar sway our moods rather than being thankful for and acting on the actual opportunities that are before us on a daily basis.
November Conference Call: 5 Key Takeaways
From the desk of Steve Strazza @Sstrazza and Ian Culley @Ianculley
On Tuesday night we held our November Monthly Conference Call, which Premium Members can access and re-watch here.
In this post, we’ll summarize it by highlighting five of the most important charts and/or themes we covered, along with commentary on each.
Let’s get right into it!
[PLUS] Weekly Sentiment Report
From the desk of Willie Delwiche.
Key Takeaway: The bulls are back as more and more investors begin to reach for risk. Optimism is expanding across investor surveys and active equity managers have increased their exposure to levels not seen since the beginning of the year. This fresh bout of risk-seeking behavior comes as both momentum and price trends have turned bullish. Also, participation beneath the surface is expanding as the major indexes reach record highs. Combine this backdrop with a healthy number of stubborn bears and we have an environment that supports the next leg higher.
Sentiment Report Chart of the Week: Appetite For Risk Returns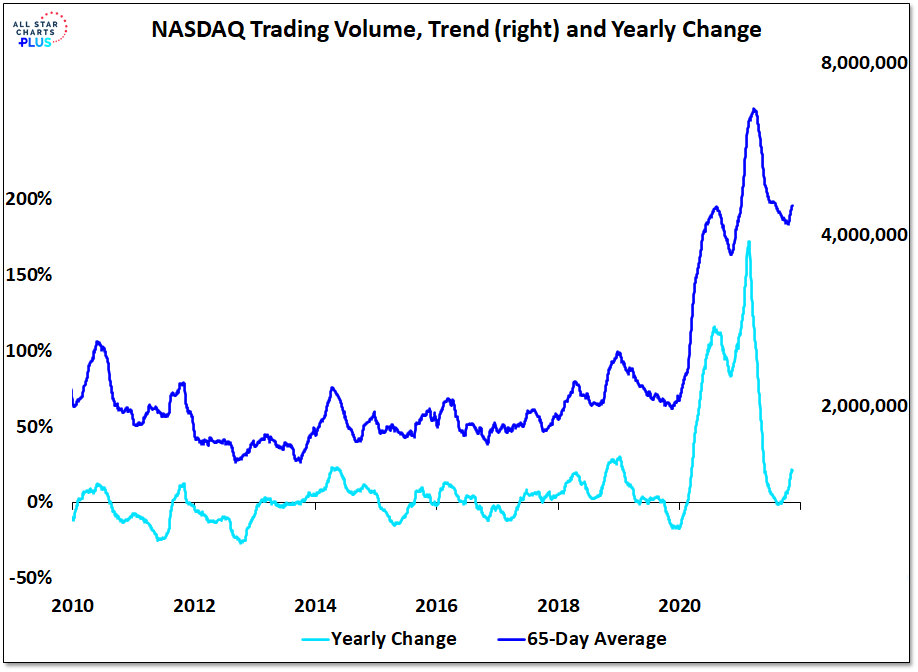
Investors are not just feeling more optimistic, they are doing something about it. NASDAQ trading volume, which fell by nearly 30% from March to October, has turned higher in recent weeks and is 20% higher than it was this time last year. Equity call option activity has also expanded as investors are stepping back up to the ‘risk on’ buffet after a multi-month fast.
[PLUS] Weekly Sentiment Report
From the desk of Willie Delwiche.
Key Takeaway: There’s nothing more bullish than new all-time highs, and there was plenty to go around as we reviewed our monthly charts over the weekend. It’s no wonder that optimism is resurfacing as stocks indexes up and down the cap-scale push to new records. Whether current sentiment will develop into the type of risk-seeking fervor that brought us into the year is unseen. But bulls continue to rise, and interestingly so do the bears. The AAII and II bears ticked higher last week, with II bears reaching levels not seen since May of last year. The backdrop is turning to optimism, but there’s still enough pessimism among investors to keep sentiment off of the risk side of the scale.
Sentiment Report Chart of the Week: Equity Love Affair Undiminished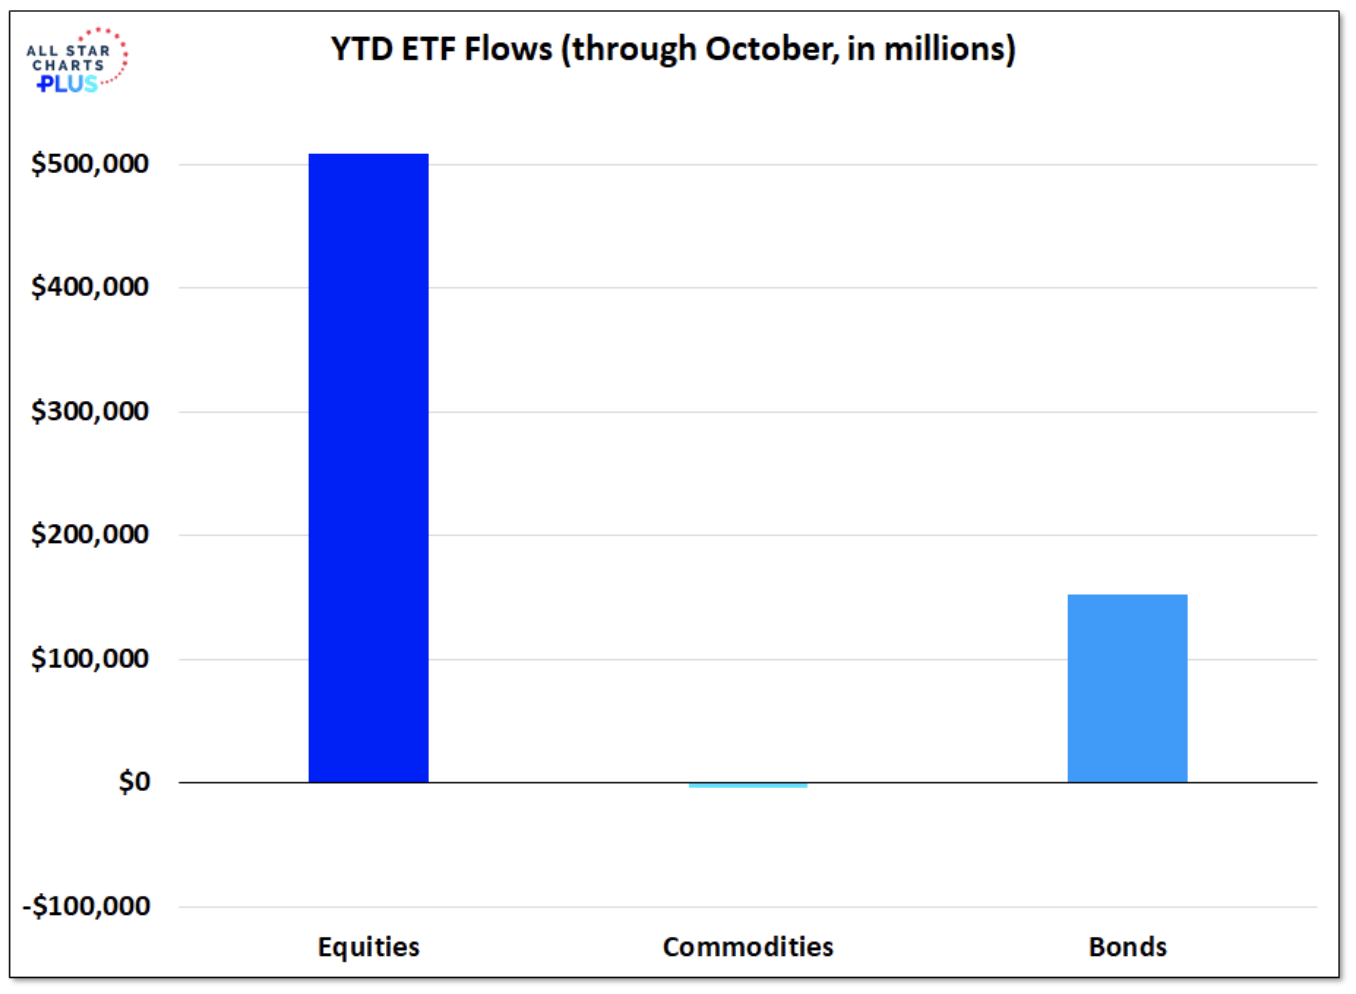
Equity ETF’s have seen half-a-trillion dollars of inflows so far this year. Bonds have seen a fraction of that. Commodity ETF’s have struggled to attract attention despite DBC (a broad commodity ETF) gaining nearly twice as much as SPY (S&P 500 ETF) this year. For a variety of reasons, commodities remain unloved and under-owned from an asset allocation perspective. Opportunity set decisions are going to weigh heavily on portfolio performance in coming years.
[PLUS] Weekly Sentiment Report
From the desk of Willie Delwiche.
Key Takeaway: There are plenty of adages to remind us that evidence of optimism re-emerging as stocks rally is neither surprising nor necessarily harmful to the health of the rally. When optimism gets overly excessive and begins to retreat we need to pay more attention to the risk side of the equation. What really caught our attention this week was that the imbalance in sentiment expressed by advisory services (Investors Intelligence) and individual investors (AAII) has been resolved. In mid-September, the AAII survey showed 22% bulls and 39% bears while the II survey had 50% bulls and 22% bears. Both surveys now show bulls in the 40’s and bears in the 20’s. Our sentiment chart of the week shows that when we’ve seen this degree of agreement between these surveys in the past, stocks have tended to do pretty well.
Sentiment Report Chart of the Week: Stocks Appreciate Survey Agreement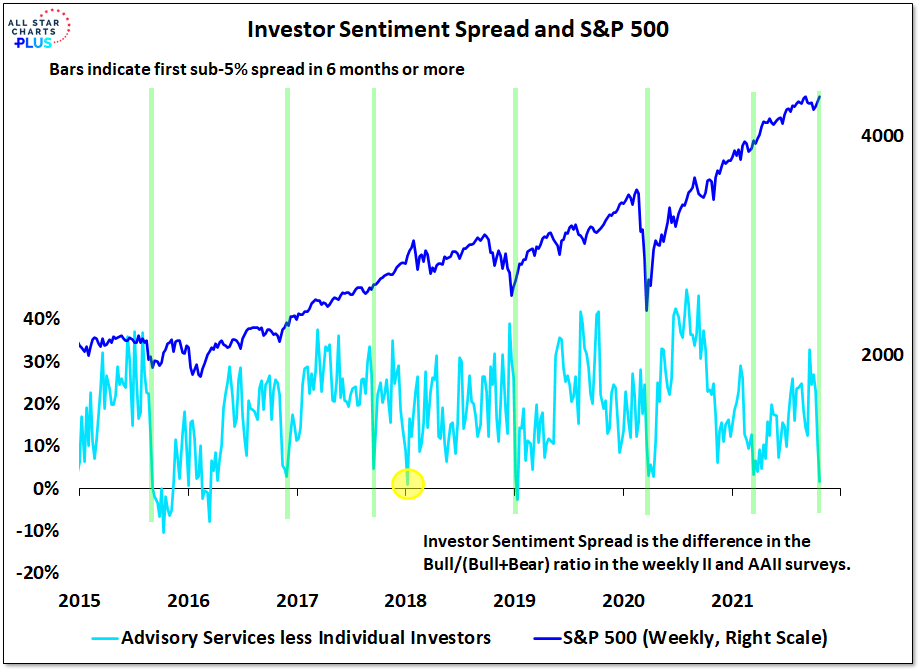
It happened in March of this year, it’s happening again – the II and AAII surveys are in agreement when it comes to bulls versus bears. When the surveys have shown such agreement in recent years stocks have tended to rally. In the wake of such sentiment spread narrowing since 2015, the S&P 500 has seen 26-week and 52-week returns that have been twice as strong as average. In the six months after the signal in March of this year, the S&P 500 was up over 13%.
[PLUS] Weekly Sentiment Report
From the desk of Willie Delwiche.
Key Takeaway: Sentiment remains neutral as bulls are on the rebound. Both II and AAII bulls ticked higher last week, and the 5-day put/call ratio dropped to levels indicating complacency. We may have seen the reset in optimism that was needed despite a lack of pessimism suggesting a complete unwind. With neither widespread fear nor clear evidence of sustained breadth improvement, the US is in limbo, challenging previous highs yet not confirming a breaking higher. Our suspicion is that a bout of disappointing news or earnings reports could quickly see nervousness and fear return. That could lead investors to search for better opportunities where sentiment has shifted from optimism to pessimism and breadth is clearly improving (EM, anyone?).
Sentiment Report Chart of the Week: Throwing In the Towel On EM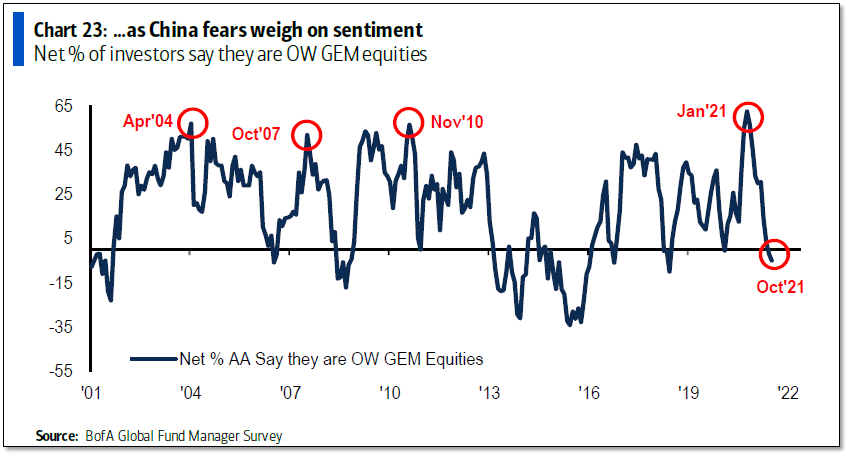
The latest BofA Fund Manager Survey shows that the widespread optimism on Emerging Markets that was present at the start of the year has turned to pessimism. Investors are currently underweight EM and looking to get increasingly so. While China dominates the EM indexes and headlines, breadth there is improving and price has started to stabilize. What the crowd is throwing out, we might want to think about picking up.
- « Previous Page
- 1
- …
- 17
- 18
- 19
- 20
- 21
- …
- 25
- Next Page »


