This is our ASC Research Q3 2021 Playbook.
- Stocks (International & U.S.)
- U.S. Sectors & Industries
- Market Breadth & Sentiment
- Commodities
- Currencies
- Intermarket Analysis
- Crypto Currencies
- New Trade Ideas
- Overall Strategy
Expert technical analysis of financial markets by JC Parets
This is our ASC Research Q3 2021 Playbook.
From the desk of Willie Delwiche.
Key takeaway: Record highs in equity indexes buoy investor sentiment that has remained optimistic without a significant challenge over the past year. Bulls ticked higher across our sentiment indicators last week, yet we still see evidence that risk appetite is turning (NAAIM Exposure Index, NASDAQ trading volume, overall levels of options activity). These new highs and levels of optimism must contend with the undercurrents of lackluster breadth measures and an absence of pessimism. Risks lie just beneath the surface. This raises the possibility of a more complete sentiment unwind when risks are realized and prices begin to falter.
Sentiment Report Chart of the Week: Know What They Say, Watch What They Do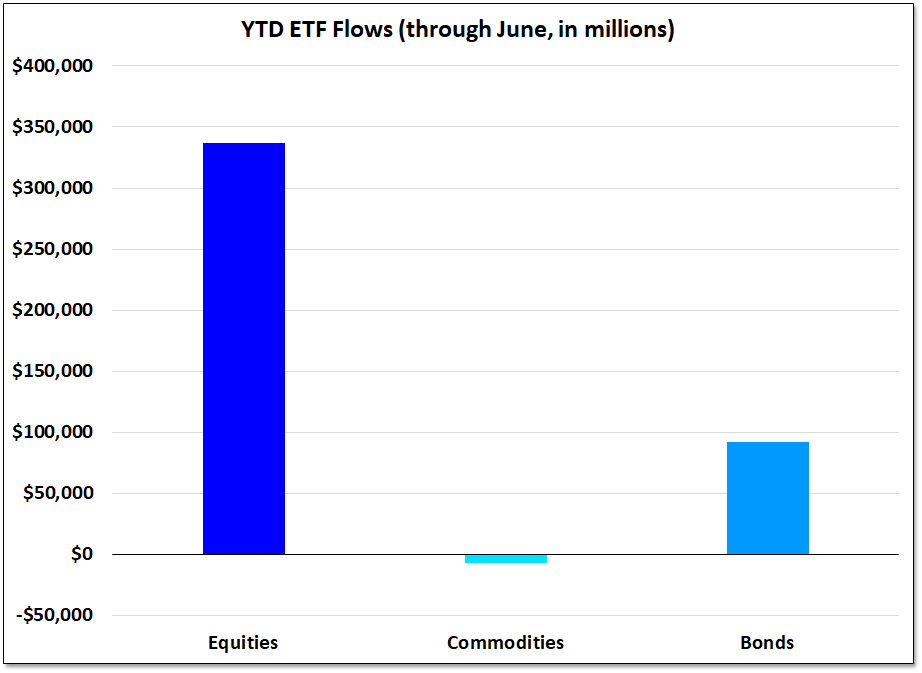
One of the best ways to measure actual sentiment is to watch what investors are doing with their money. Through the first six months of the year, equity ETF inflows totaled nearly $350 billion, with inflows to bond ETFs falling shy of $100 billion. Commodity ETFs have seen outflows on a YTD basis.
From the desk of Willie Delwiche.
Key takeaway: Last week’s volatility unwound some near-term complacency, but there is still plenty of evidence of optimism in the system. Active managers increased their equity exposure and equity ETFs continue to attract inflows at a staggering pace (though certain sectors are starting to see outflows). A more challenging breadth backdrop poses a challenge, but with economic data continuing to surprise to the upside and earnings expectations being revised higher, excessive optimism may be slow to unwind. While risks are elevated from a sentiment perspective, they are not yet being manifested in terms of price.
Sentiment Report Chart of the Week: Large Tech Outflows
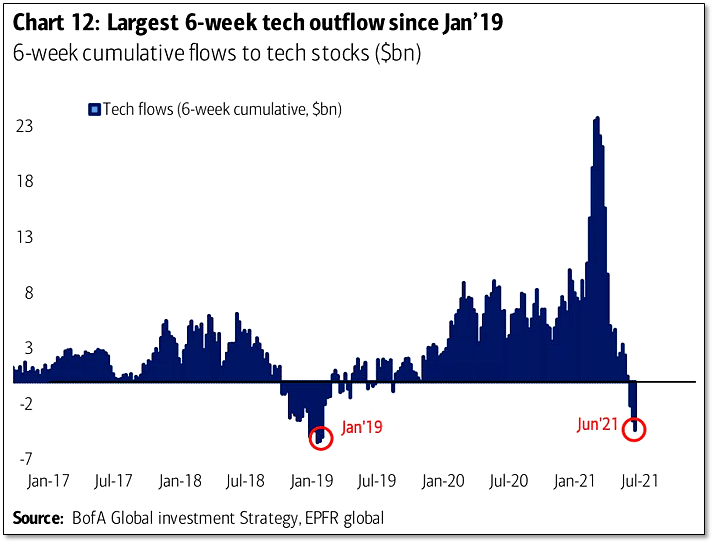
Outflows among tech stocks spiked to their highest level since early 2019. The recent spike comes after historic inflows and speculative exuberance took hold of the market. Now the market environment is portrayed by waning trading volume and a sharp decline in call option activity. We may be in the early stages of sustained outflows if sentiment experiences a full unwind.
From the desk of Willie Delwiche.
Key takeaway: From a breadth perspective, the market is challenged right now by a scarcity of new highs. From a sentiment perspective, it has to contend with a scarcity of bears. Options data shows complacency even as risk appetites remain diminished. Bears on both the II and AAII surveys are near their lowest levels since 2018 and ETF inflows remain elevated. The household equity allocation tilt (versus bonds) is its most extreme since 1972. Stocks are loved, bonds are hated. All of this is very well summarized by our chart of the week from the Bank of America Fund Manager Survey which shows virtually no one is expecting (or prepared for) market volatility in the months ahead.
Sentiment Report Chart of the Week: Missing Bears
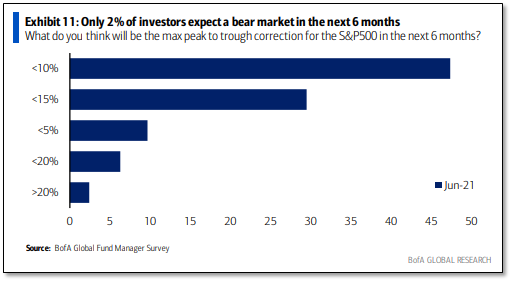
It takes bulls to make a bull market, but it takes bears to help sustain it. The Bank of America Fund Managers Survey found only 2% expect a correction >20% in the next six months, emphasizing the lack of pessimism amongst investors. An acceleration in a sentiment unwind could very quickly remedy this situation.
From the desk of Willie Delwiche.
Key takeaway: Excessive optimism has been slow to unwind and most of our indicators are back to signalling a high risk environment from a sentiment perspective. Individual investors last week showed the fewest bears since January 2018. While complacency abounds, investor risk appetite remains shy of where it was in March, even with the uptick in speculative activity over the last two weeks. Liquidity conditions have been tightening of late and momentum trends are diverging from price trends. While the apple cart has not been upset, the load is perched precariously and one small stumble could send fruit flying in all directions. It’s not a low-risk load on which to ride.
Sentiment Report Chart of the Week: Shifting Leadership?
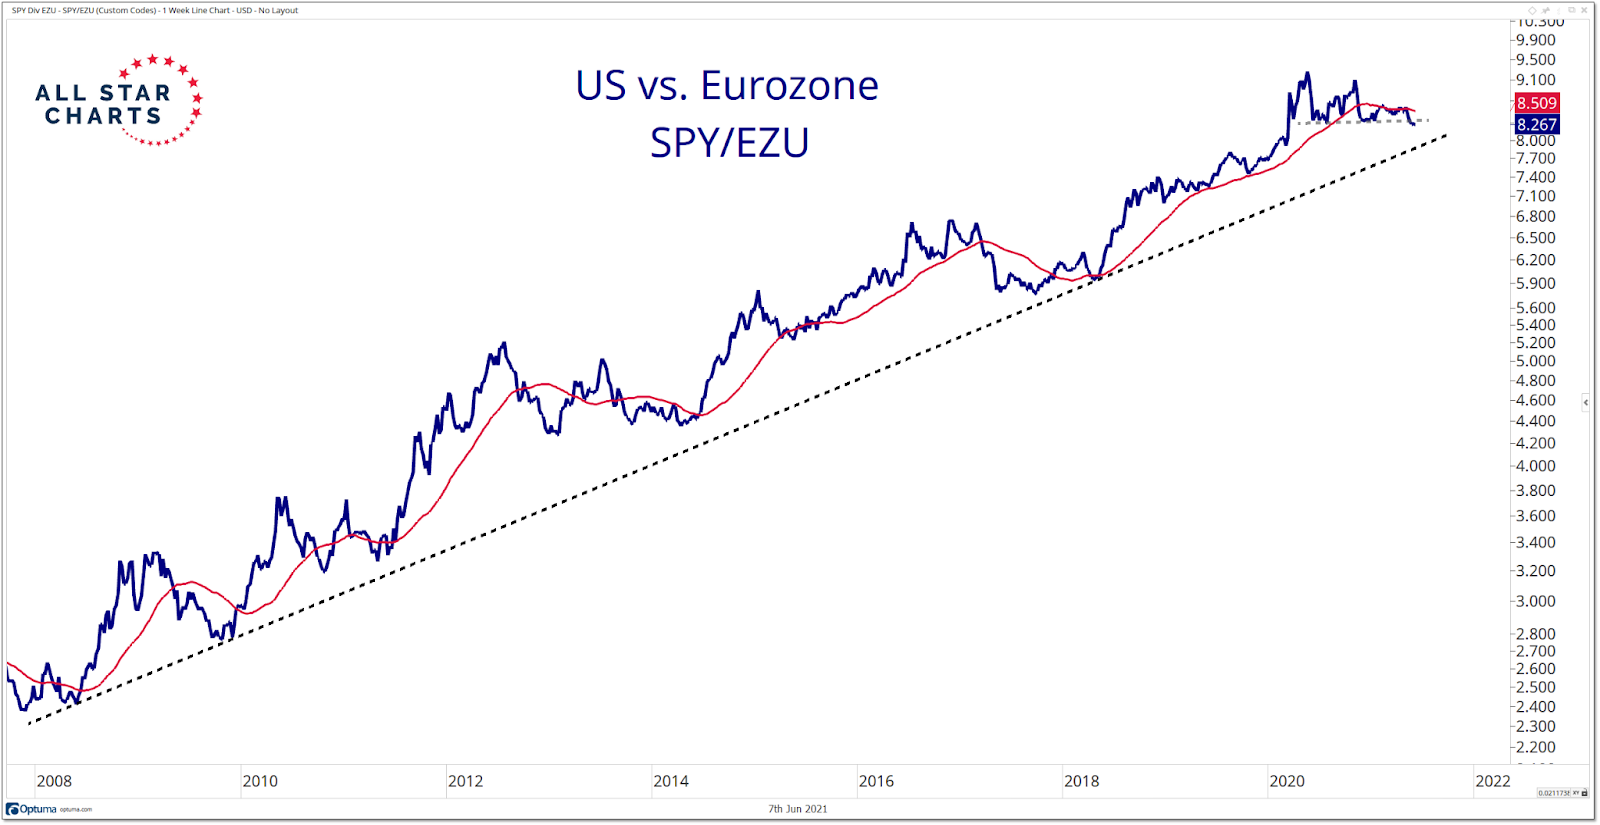
The decade-long trend of US outperformance remains intact. However, more and more information points toward a possible trend reversal. The S&P 500 ETF $SPY breaks to new lows relative to Eurozone ETF $EZU. Further weakness in the SPY/EZU ratio below the long-term trend line would signify a market environment that many investors are not prepared for.
From the desk of Willie Delwiche.
Key takeaway: Sentiment continues to shift away from optimism and toward pessimism, though as with anything it is not a straight line. Speculative activity is flaring up again this week, the trend in trading volumes and call activity suggests less risk appetite on the part of investors. Optimism unwind is happening in the context of elevated longer-term risks, with earnings growth expectations and valuations at elevated levels. A sideways summer that cools optimism and helps relieve valuation pressures could help pave the way for the resumption of a cyclical rally later this year.
Sentiment Report Chart of the Week: Diminishing Highs
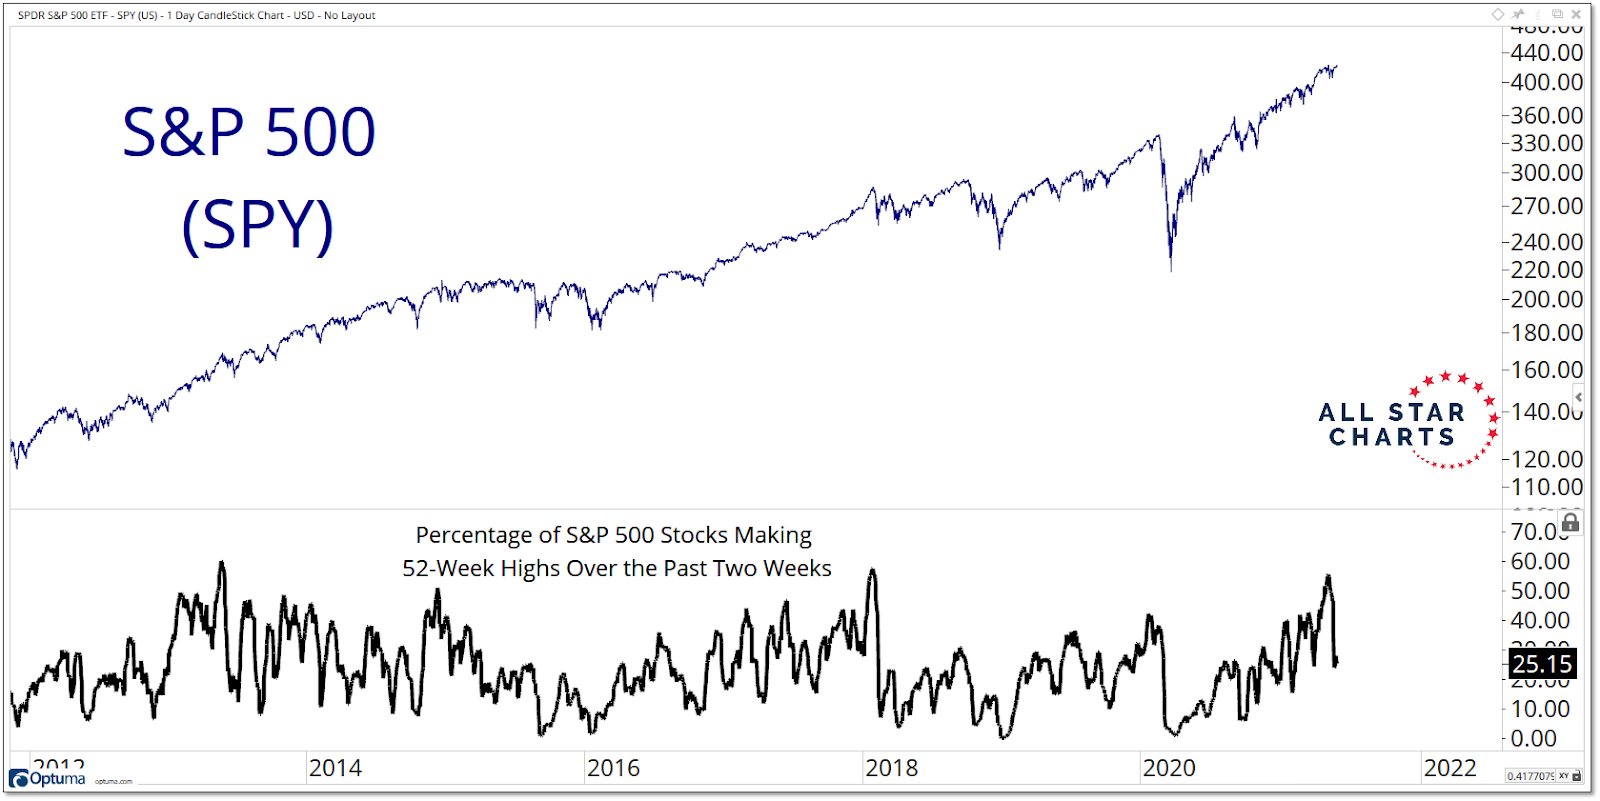
As optimism fades, so does the number of new 52-week highs in the S&P 500. It takes bulls to make a bull market, and from a tactical perspective, our sentiment and breadth measures suggest the bulls have already left for summer vacation.


