This is the weekly post that aggregates all the charts we put together throughout the week and organizes them all into one, easy to flip through deck.
Expert technical analysis of financial markets by JC Parets
This is the weekly post that aggregates all the charts we put together throughout the week and organizes them all into one, easy to flip through deck.
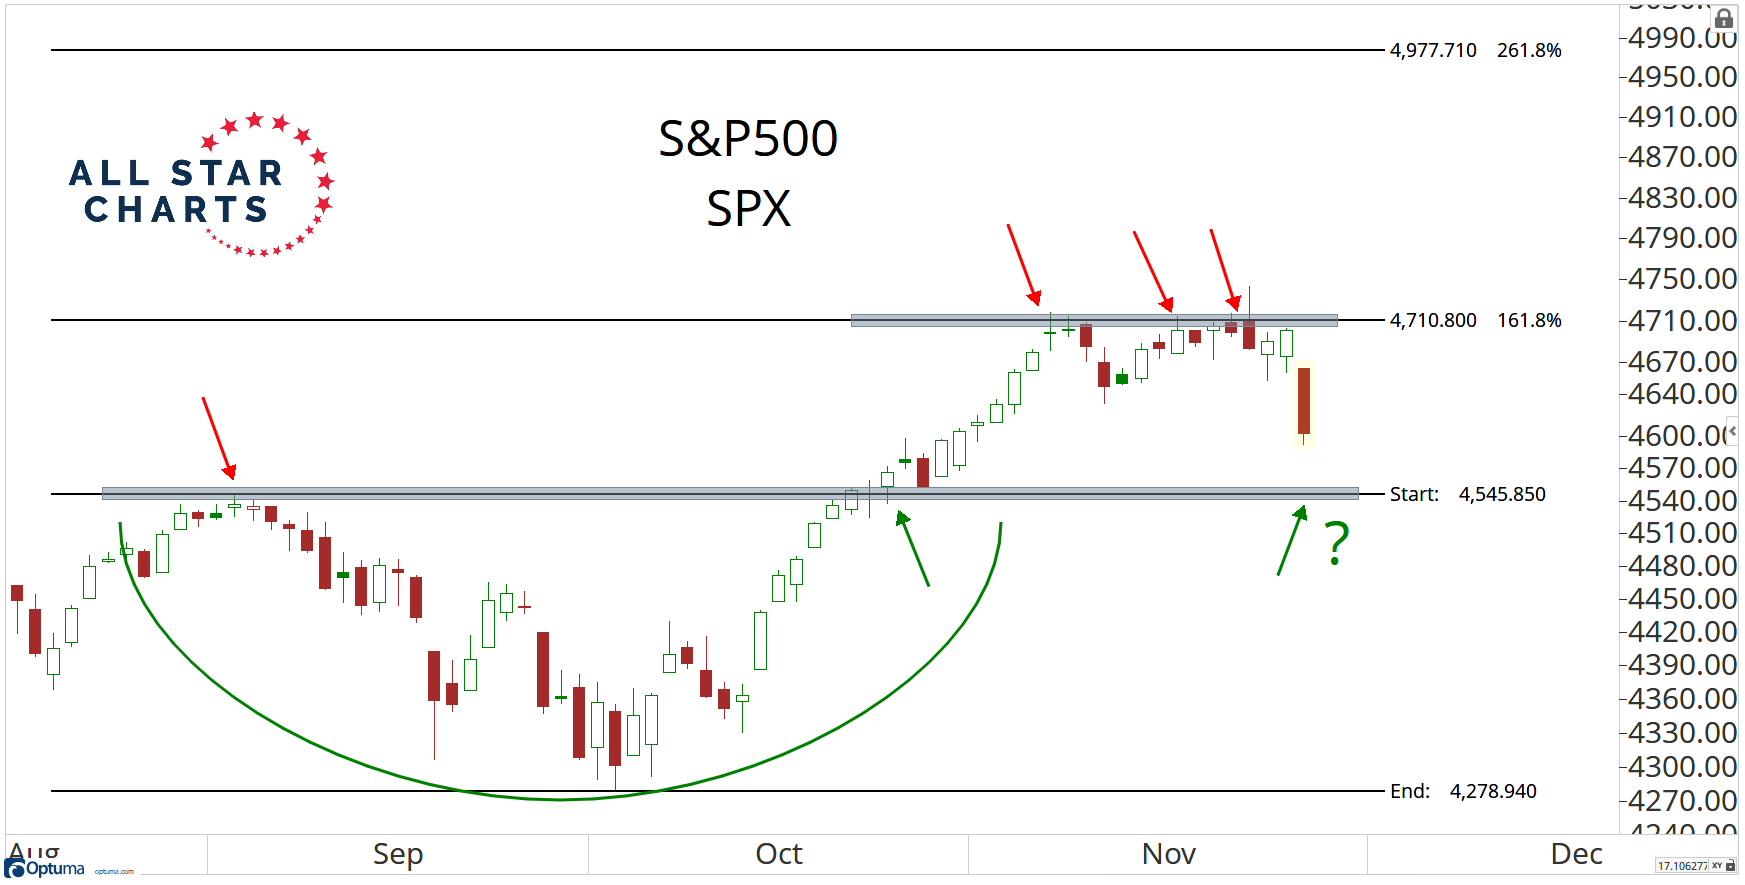
The market has been in a corrective mode for a little over a month. While this correction has been gaining some momentum, we took a look at the breadth internals of the market at this stage to dig a little deeper.
One important factor when the market was making new highs, was a lack of breadth expansion.
Now the important factor when the market is making lows is breadth expansion.
From the desk of Steve Strazza @Sstrazza
Our International Hall Of Famers list is composed of the largest US-listed international stocks, or ADRs. We’ve also sprinkled in some of the largest ADRs from countries that did not make the market cap cut.
These stocks range from some well-known mega-cap multinationals such as Toyota Motor and Royal Dutch Shell to some large-cap global disruptors such as Sea Ltd and Shopify.
It’s got all the big names and more–but only those that are based outside the US. You can find all the largest US stocks on our original Hall Of Famers list.
The beauty of these scans is really in their simplicity.
We take the 50 largest names each week and then apply technical filters in a way that the strongest stocks with the most momentum rise to the top.
Based on the market environment, we can also flip the scan on its head and filter for weakness. Due to the recent volatility, we’re going to do that today.
Let’s dive in and take a look at some of the most important stocks from around the world.

In this podcast episode I sit down with one of my favorite technicians of all-time – John Roque. This is one of those people who influenced my thinking very early on. The combination of his simplicity along with sports analogies to describe market behavior made me a huge fan of his right away. This was about 15 years ago.
Since then, you’ll here me throw out John Roqueisms all the time. I learned a lot from his way of thinking.
In this conversation we talk about the stock market, Gold, Bitcoin and Tech stocks. John also shares some fun stories about those who inspired him throughout his career and some of the things he’s learned more recently.
This was a lot of fun and a real treat for me.
From the desk of Steve Strazza @sstrazza
Welcome to our latest RPP Report, where we publish return tables for various asset classes and categories, along with commentary on each.
Looking at the past helps put the future into context. In this post, we review the absolute and relative trends at play and preview some of the things we’re watching to profit in the weeks and months ahead.
We consider this our state of the union address, as we break down and reiterate both our tactical and structural outlook on various asset classes. Our ultimate goal is to discuss the most important themes and developments that are currently playing out in markets around the world.
There’s been plenty of action these past few weeks. Let’s kick things off with stocks and try to make sense of what we’re seeing.
We debuted a new scan recently which goes by the name- All Star Momentum.
All Star Momentum is a brand new scan that pinpoints the very best stocks in the market. This time around, we have incorporated our stock universe of Nifty 500 as the base. Among the 500 stocks that we follow, this scan will pump out names that are most likely to generate great returns.
From the desk of Steve Strazza @Sstrazza
Welcome to the 2 to 100 Club.
As many of you know, something we’ve been working on internally is using various bottom-up tools and scans to complement our top-down approach. It’s really been working for us!
One way we’re doing this is by identifying the strongest growth stocks as they climb the market-cap ladder from small- to mid- to large- and, ultimately, to mega-cap status (over $200B).

Once they graduate from small-cap to mid-cap status (over $2B), they come on our radar. Likewise, when they surpass the roughly $30B mark, they roll off our list.
But the scan doesn’t just end there. We only want to look at the strongest growth industries in the market, as that is typically where these potential 50-baggers come from.
Some of the best performers in recent decades – stocks like Priceline, Amazon, Netflix, Salesforce, and myriad others – would have been on this list at some point during their journey to becoming the market behemoths they are today.
When you look at the stocks in our table, you’ll notice we’re only focused on Technology and Growth industry groups such as Software, Semiconductors, Online Retail, Solar, etc.
Then, like any good technician, we filter the list down to those that are closest to new highs. This allows the cream of these strong groups to rise to the top and helps streamline our mission to identify technical breakouts in the top-performing stocks.


