The largest insider transaction on today’s list is a Form 4 filing by Jan Barta of Pale Fire Capital.
Barta continues to grow his position in Groupon $GRPN, as this is the second large Form 4 filing in the last two weeks.
Expert technical analysis of financial markets by JC Parets
The largest insider transaction on today’s list is a Form 4 filing by Jan Barta of Pale Fire Capital.
Barta continues to grow his position in Groupon $GRPN, as this is the second large Form 4 filing in the last two weeks.
From the desk of Steven Strazza @Sstrazza and Ian Culley @IanCulley
The turmoil in equity markets has stolen all the attention since last year. But stocks aren’t the only asset class that’s a mess. We’re getting the same kind of mixed signals and sloppy price action from forex markets.
While stocks remain under pressure, currencies have been throwing head fakes and dishing out whipsaws all year long. The AUD/USD broke to fresh nine-month highs just last week only to reverse 200 pips by Friday’s close.
We’re seeing this type of action from currencies all over the world. It’s hard to trust a breakout these days. As frustrating as these failed moves may be, there are some clean chart patterns and favorable setups shaping up right now.
One area where the trend is very clear is the Japanese yen. Just about anything priced in Yen has been rallying recently as the currency continues to collapse.
Today, we’re going to highlight the massive base in the USD/JPY.
Lets’ dive in.
Abdiel Capital Management LLC reported a $2.6 million purchase in the cloud computing and enterprise software stock Appian Corporation $APPN.
The firm now owns more than 5.9 million shares, representing a 15% ownership interest.
From the desk of Steve Strazza @Sstrazza
Welcome to our latest Minor Leaguers report.
We’ve had some great trades come out of this small-cap-focused column since we launched it back in 2020 and started rotating it with our flagship bottom-up scan, Under the Hood.
For the first year or so, we focused only on Russell 2000 stocks with a market cap between $1 and $2B.
That was fun, but we wanted to branch out a bit and allow some new stocks to find their way onto our list.
The way we did this is simple…
To make the cut for our revised Minor Leaguers list, a company must have a market cap between $1B and $4B.
And it doesn’t have to be a Russell component–it can be any US-listed equity. With participation expanding around the globe, we want all those ADRs in our universe.
After our price and liquidity filters are applied, we sort by proximity to new highs in order to focus on the best players.
But, instead of all-time highs, we’re sorting by 52-week highs these days, as we don’t want to discriminate against energy or other cyclical stocks.
The goal is to catch the strongest names while they’re still small and have serious upside potential. If any of these stocks ever climb the ranks to the big leagues, the returns could be huge.
We’re looking at up to 10x moves just to break into large-cap land!
Let’s dive into this week’s report and see what’s happening in some of the hottest stocks in the Minor Leagues.
From the desk of Steve Strazza @sstrazza
This is one of our favorite bottom-up scans: Follow the Flow. In this note, we simply create a universe of stocks that experienced the most unusual options activity — either bullish or bearish, but NOT both.
We utilize options experts, both internally and through our partnership with The TradeXchange. Then, we dig through the level 2 details and do all the work upfront for our clients.
Our goal is to isolate only those options market splashes that represent levered and high-conviction, directional bets.
 We also weed out hedging activity and ensure there are no offsetting trades that either neutralize or cap the risk on these unusual options trades.
What remains is a list of stocks that large financial institutions are putting big money behind… and they’re doing so for one reason only: because they think the stock is about to move in their direction and make them a pretty penny.
Then we flip through our list of stocks flashing unusual activity and pick the best setups using many of the same technical filters we do for our other scans. And just like that, we’ll follow the money flow and fatten our own pockets along with some of the world’s most powerful financial institutions.
From the desk of Steve Strazza @Sstrazza
Our Top 10 Charts Report was just published.
In this weekly note, we highlight 10 of the most important charts or themes we’re currently seeing in asset classes around the world.
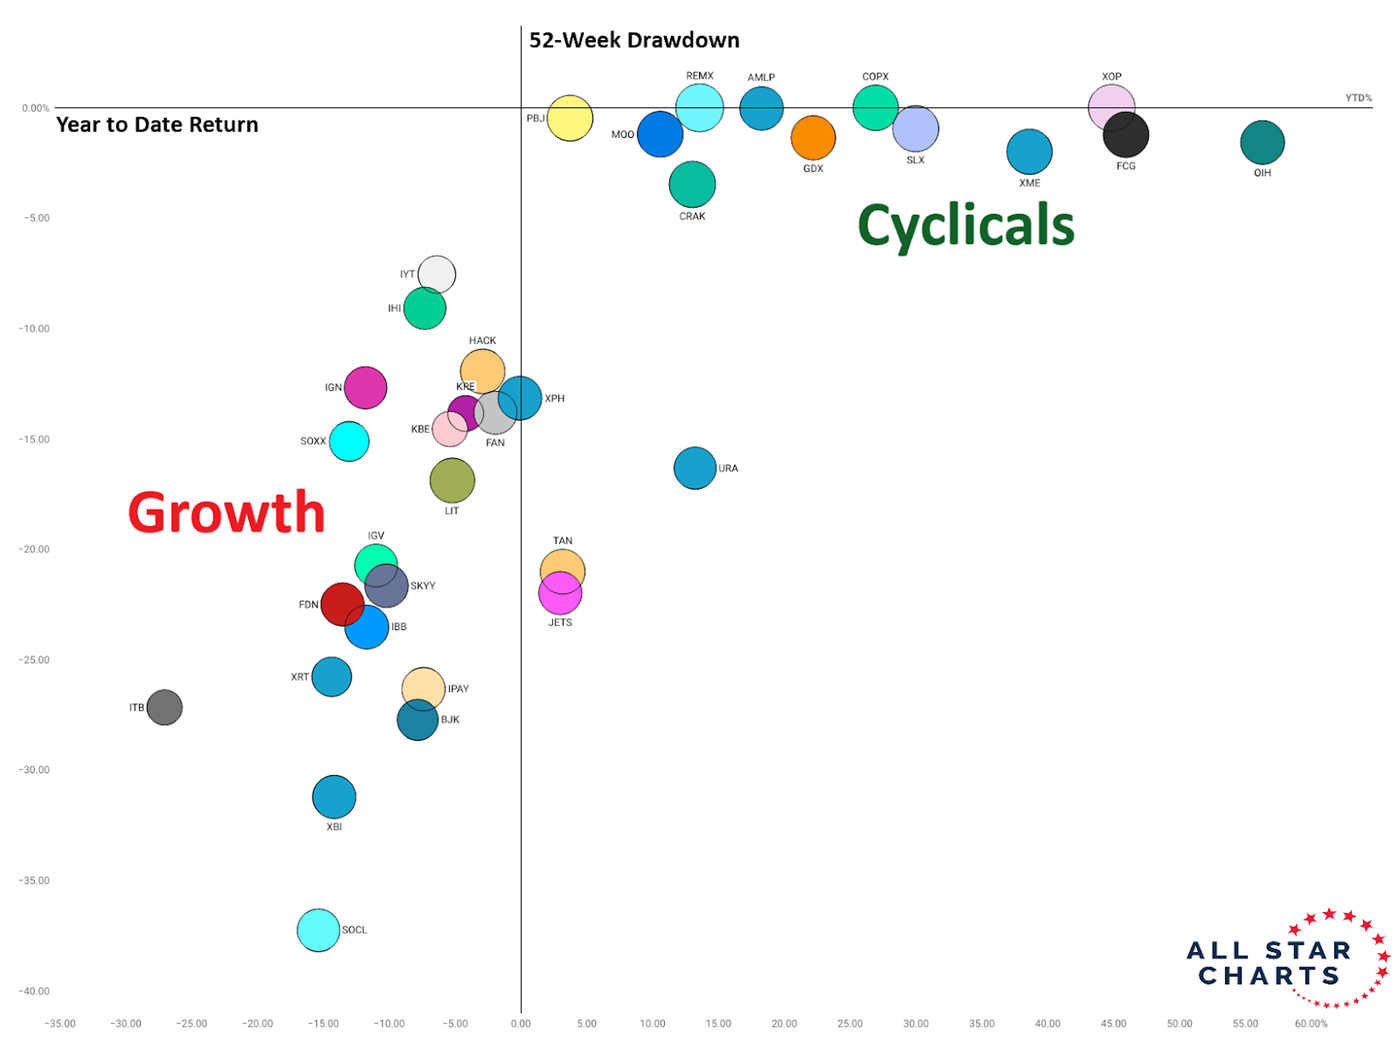
A Tale Of Two Markets
2022 has been a tale of two markets. On the one hand, cyclical stocks have shown impressive leadership as they continue to trend higher and make new highs. But then there are growth stocks which continue to lag significantly as they struggle to find a bottom. While this trend is really nothing new, it has accelerated notably in recent months. The bubble chart below is a great way to visualize the dispersion in performance between these two groups of stocks. Whether the leaders catch lower, or the laggards eventually play catch-up is something we’ll have to wait and see. But for now, the two are moving in opposite directions. As long as this is the case, we want to continue positioning ourselves in the strongest groups while staying away from the weakest ones.
From the desk of Steve Strazza @Sstrazza
Check out this week’s Momentum Report, our weekly summation of all the major indexes at a Macro, International, Sector, and Industry Group level.
By analyzing the short-term data in these reports, we get a more tactical view of the current state of markets. This information then helps us put near-term developments into the big picture context and provides insights regarding the structural trends at play.
Let’s jump right into it with some of the major takeaways from this week’s report:
* ASC Plus Members can access the Momentum Report by clicking the link at the bottom of this post.
From the desk of Steve Strazza @Sstrazza
We held our April Monthly Strategy Session last week. Premium Members can click here to review the recording and download the chartbook.
Non-members can get a quick recap of the call simply by reading this post each month.
By focusing on long-term, monthly charts, the idea is to take a step back and put things into the context of their structural trends.
This is easily one of our most valuable exercises, as it forces us to put aside the day-to-day noise and simply examine markets from a “big picture” point of view.
With that as our backdrop, let’s dive right in and discuss three of the most important charts and/or themes from this month’s call.


