We’ve been looking out for this filing since last week!
Right on time, Uncle Warren strikes again with the Berkshire put in Occidental Petroleum $OXY.
Expert technical analysis of financial markets by JC Parets
We’ve been looking out for this filing since last week!
Right on time, Uncle Warren strikes again with the Berkshire put in Occidental Petroleum $OXY.
This is the video recording of the March 8, 2023, Inside Scoop Weekly Strategy Session.
From the desk of Steve Strazza @Sstrazza
We held our March Monthly Strategy Session on Monday night. Premium Members can access and rewatch it here.
Non-members can get a quick recap of the call simply by reading this post each month.
By focusing on long-term, monthly charts, the idea is to take a step back and put things into the context of their structural trends. This is easily one of our most valuable exercises as it forces us to put aside the day-to-day noise and simply examine markets from a “big-picture” point of view.
With that as our backdrop, let’s dive right in and discuss three of the most important charts and/or themes from this month’s call.
The largest insider buy on today’s list comes from DISH Network Corporation $DISH co-founder and executive vice-president, James DeFranco.
DeFranco revealed a purchase of $15.7 million worth of DISH shares in his latest Form 4.
From the Desk of Steve Strazza @Sstrazza.
Welcome back to Under the Hood, where we’ll cover all the action for the week ended March 3, 2023. This report is published bi-weekly and rotated with The Minor Leaguers.
What we do here is analyze the most popular stocks during the week and find opportunities to either join in and ride these momentum names higher, or fade the crowd and bet against them.
We use a variety of sources to generate the list of most popular names.
There are so many new data sources available that all we need to do is organize and curate them in a way that shows us exactly what we want: a list of stocks that are seeing an unusual increase in investor interest.
Whether we’re measuring increasing interest based on large institutional purchases, unusual options activity, or simply our proprietary lists of trending tickers, there’s a lot of overlap.
From the desk of Steve Strazza @Sstrazza
Our Top 10 Charts Report was just published.
In this weekly note, we highlight 10 of the most important charts or themes we’re currently seeing in asset classes around the world.
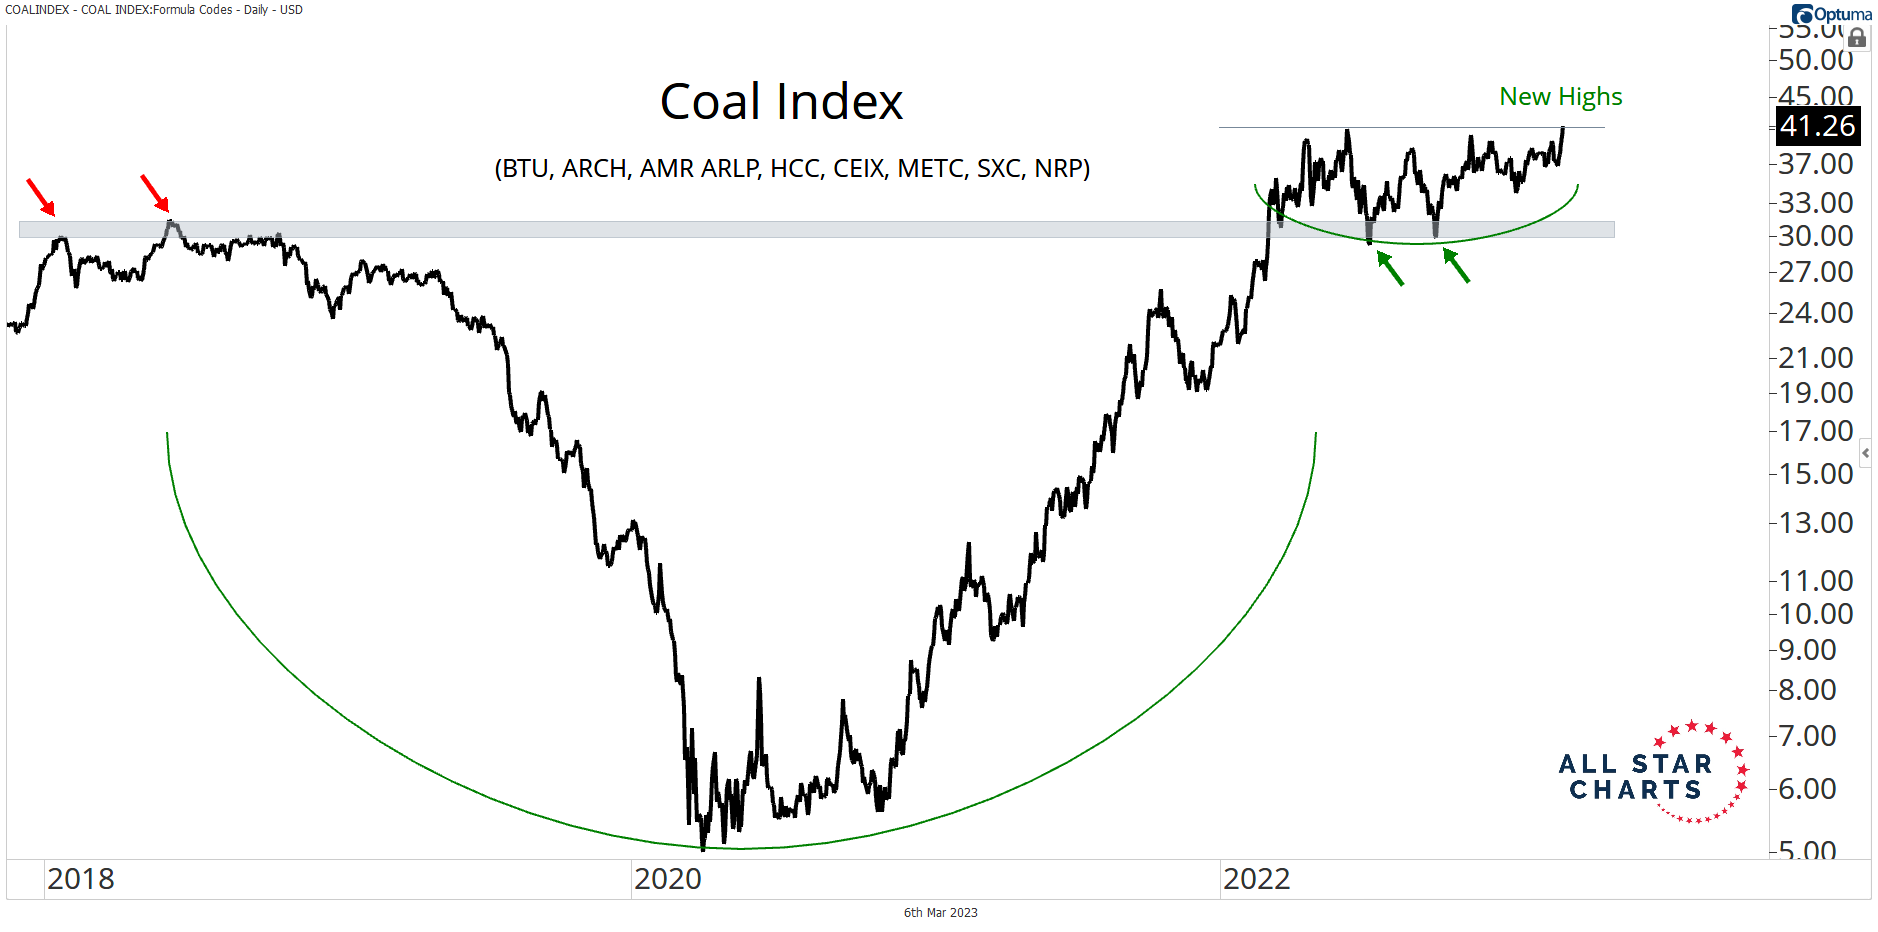
Don’t Ignore Coal
Our equal-weighted custom index of the largest coal stocks reached new highs last week. If this breakout sticks, coal is a group we want to keep leaning on for long exposure.
From the Desk of Steve Strazza @sstrazza and Alfonso Depablos @Alfcharts
This is one of our favorite bottom-up scans: Follow the Flow.
In this note, we simply create a universe of stocks that experienced the most unusual options activity — either bullish or bearish, but not both.
We utilize options experts, both internally and through our partnership with The TradeXchange. Then, we dig through the level 2 details and do all the work upfront for our clients.
Our goal is to isolate only those options market splashes that represent levered and high-conviction, directional bets.
 We also weed out hedging activity and ensure there are no offsetting trades that either neutralize or cap the risk on these unusual options trades.
What remains is a list of stocks that large financial institutions are putting big money behind.
And they’re doing so for one reason only: because they think the stock is about to move in their direction and make them a pretty penny.
Then we flip through our list of stocks flashing unusual activity and pick the best setups using many of the same technical filters we do for our other scans.
And, just like that, we’ll follow the money flow and fatten our own pockets along with some of the world’s most powerful financial institutions.
From the desk of Steve Strazza @Sstrazza
Check out this week’s Momentum Report, our weekly summation of all the major indexes at a Macro, International, Sector, and Industry Group level.
By analyzing the short-term data in these reports, we get a more tactical view of the current state of markets. This information then helps us put near-term developments into the big picture context and provides insights regarding the structural trends at play.
Let’s jump right into it with some of the major takeaways from this week’s report:
* ASC Plus Members can access the Momentum Report by clicking the link at the bottom of this post.


