One of the most valuable tools we have as technicians is the ability to go through every single stock in the Dow Jones Industrial Average and every sector and sub-sector in the S&P500 so that we can weigh all of the evidence. It might take some time, but I promise you that there is no better way to gauge the strength or weakness in a market, than by going through them all. Since most people don’t have the time to do this work as regularly as I do, my annotations and notes can easily be referenced in the Chartbook.
Today I wanted to share some of my conclusions after running through all of the Dow Components and S&P Sectors on both weekly and daily timeframes. This analysis consists of over 120 charts and all of them have been updated today in the Chartbook. [Read more…]

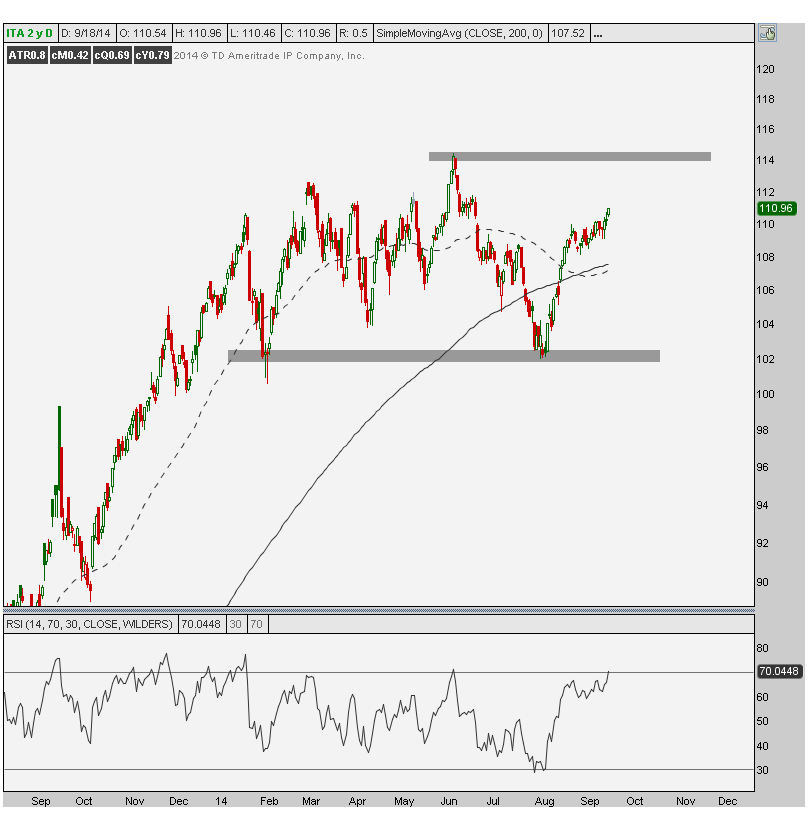
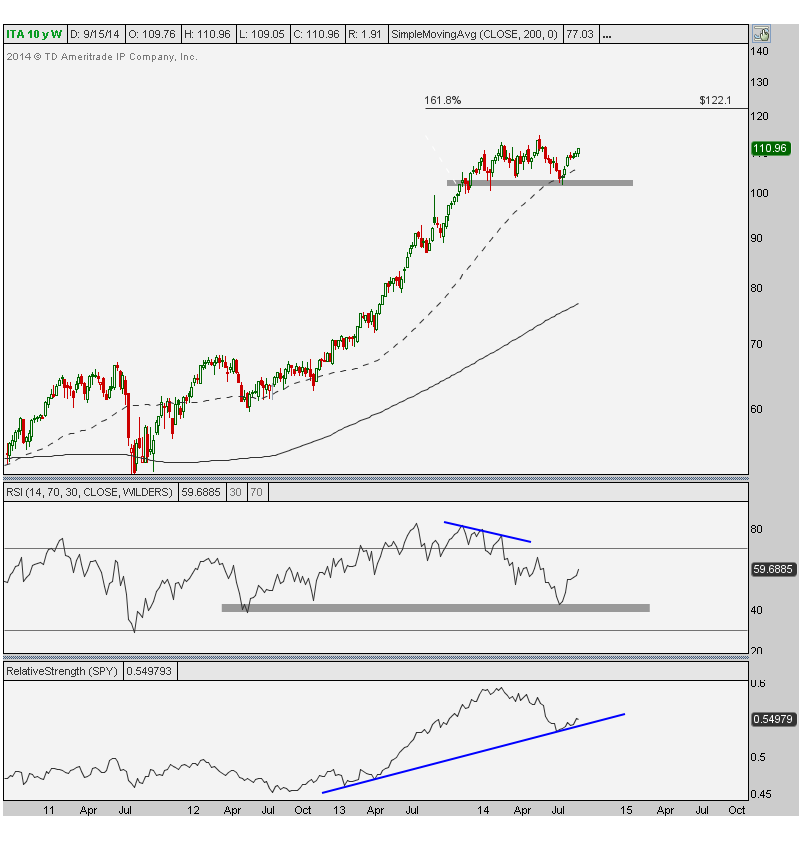 Also notice relative strength plotted at the bottom, which had also been correcting, starting to turn up. This is another good sign from a longer-term structural perspective. We are still maintaining a $122 target which we arrive at by taking the 161.8% Fibonacci extension from this entire consolidation. Structurally, we only like this name above support from the last year. Below that and things get hairy.