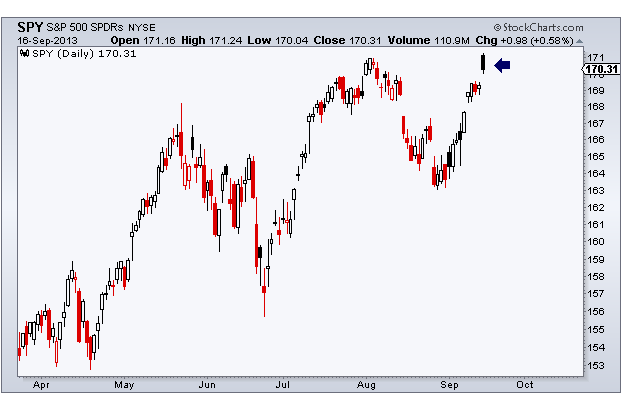
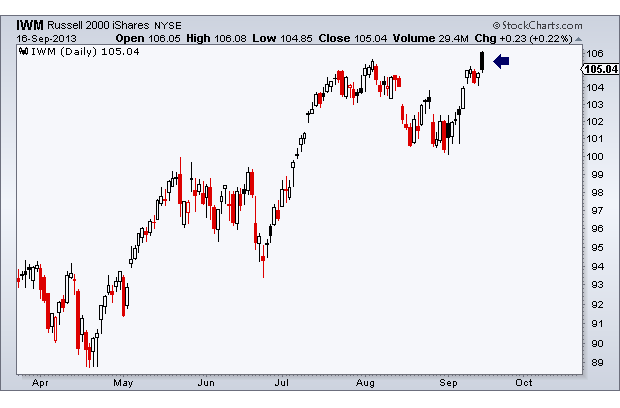
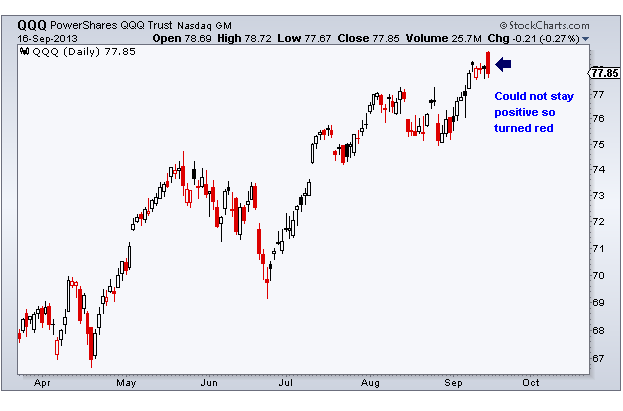
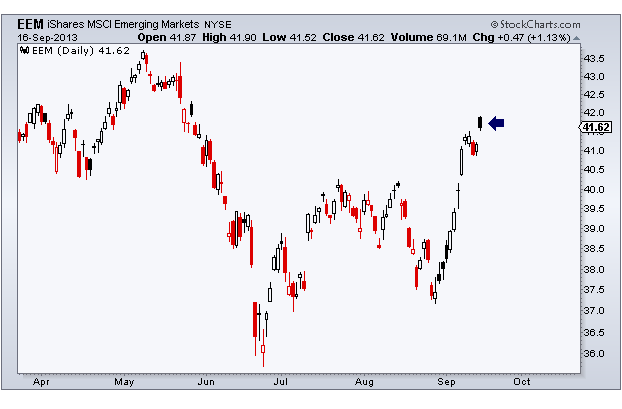
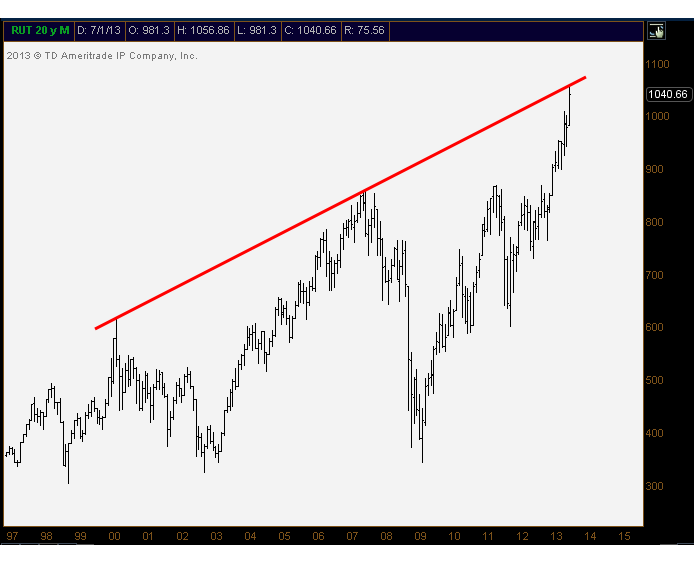
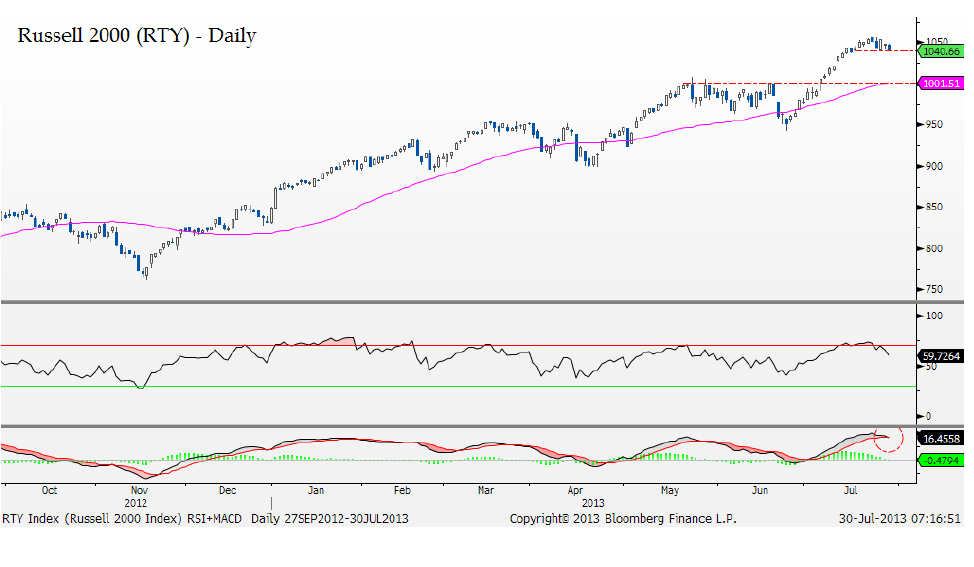
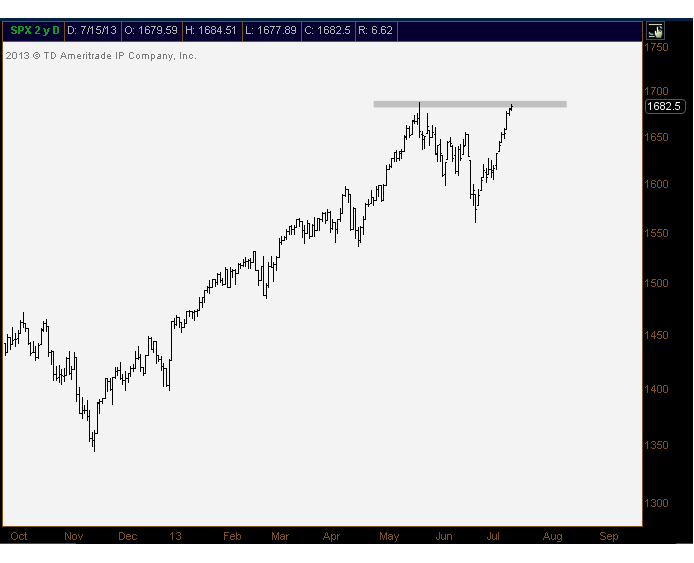
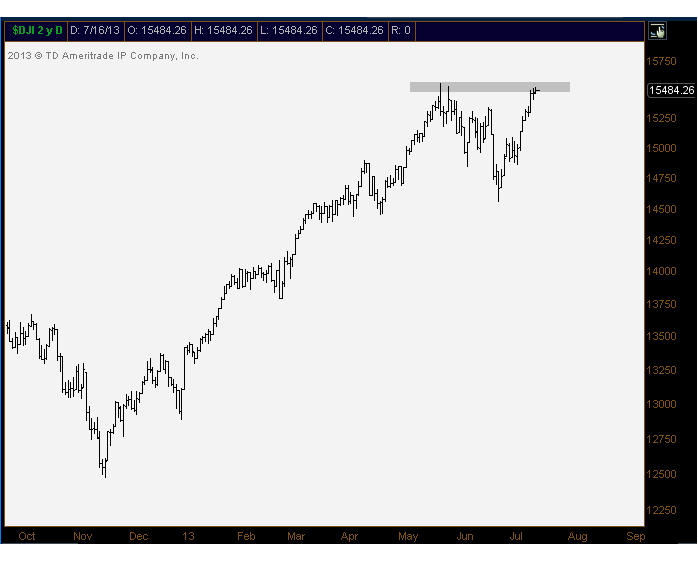
Some of us like to complicate things. And that’s cool. But keeping things simple is more my style. As a technician I have quite the dilemma on my hands as there aren’t any more former support and resistance levels that I can refer to in order to make my trading decisions. Excuse the pun, but we are in “uncharted territory” in many of the averages.
Back in May I wrote a piece for my pal Andy Nyquist over at See It Market about how to look for price targets in this sort of uncharted environment. And today we’re taking a look at the trading decisions we’re making live using that strategy.
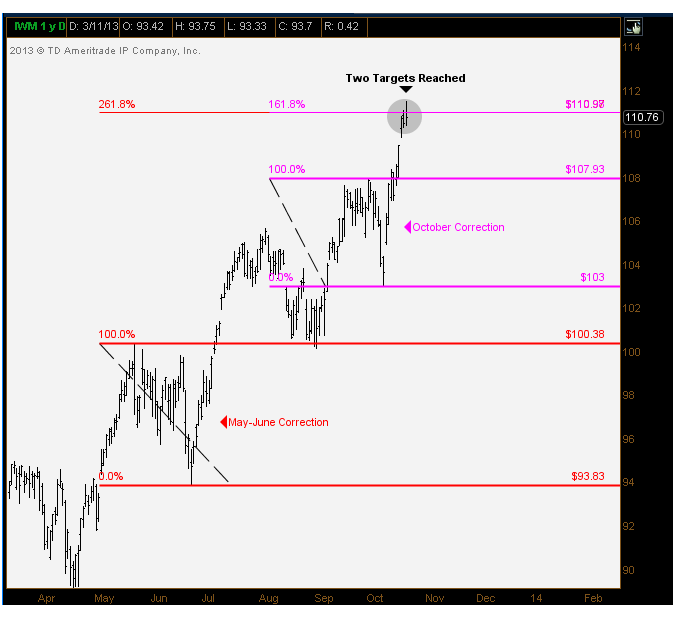
Here is the iShares Russell2000 ETF $IWM with two key Fibonacci extension targets being achieved as we speak. This sets up for an easy risk/reward short opportunity. If we’re right then we’ll probably do really well. And if we’re wrong, we have well-defined risk parameters that meet our standards.
In this chart I highlighted two key corrections: The May 22nd to June 24th sell-off and the October 1st to 10th correction earlier this month. The 261.8% Fibonacci extension from May takes us to just above 111 and the most recent 161.8% extension from October gives us the same target. So we have two important extension targets converging at the exact same price. That stands out to me.
So if we’re wrong, that’s cool. But if we’re right, I think we’ll hit it out of the park. It’s all about the risk/reward for us. I don’t care about your taper or your debt ceilings. I’m not interested in your p/e ratios or Warren Buffett’s track record from the 1980s. To me, it’s all about defined risk, and in this case I believe we have that.
I’m short.
Tags: $IWM $RUT