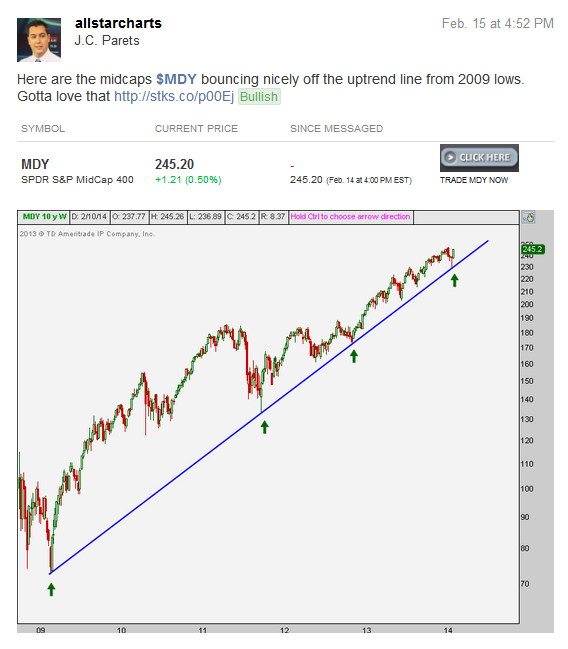
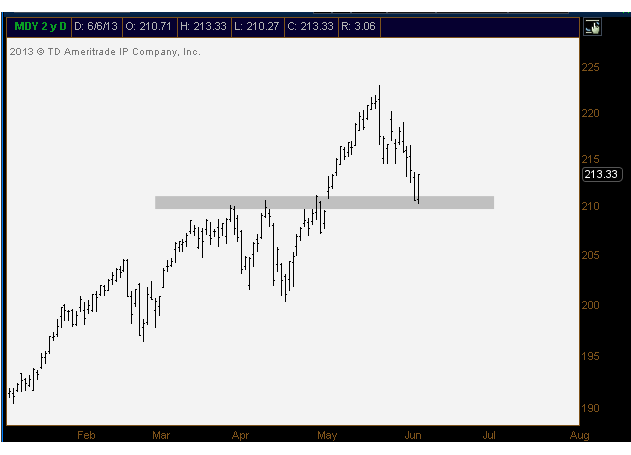
Normally it’s either the Large-Cap Indexes like the S&P500 and Dow Industrials or the Small-Cap Russell2000 that get all of the attention. But there is a whole other universe of stocks that are stuck in the middle; not big enough to be a Large-Cap nor small enough to be a Small-Cap. These Jan Brady Mid-Caps are stocks with a market capitalization between $2B and $10B. Names like 3D Systems $DDD, Foot Locker $FL and Cheesecake Factory $CAKE fall into this category.
We start with a weekly logarithmic candlestick chart of $MDY for a more structural perspective and work our way down to the near term for execution and risk management. Here we can see that in July prices of the Mid-Cap ETF broke a major uptrend line from the 2009 lows. This broken uptrend line that had served as support for so long now appears to be turning into resistance:
*** Click here to learn more about each of our Eagle Bay Solution products ***
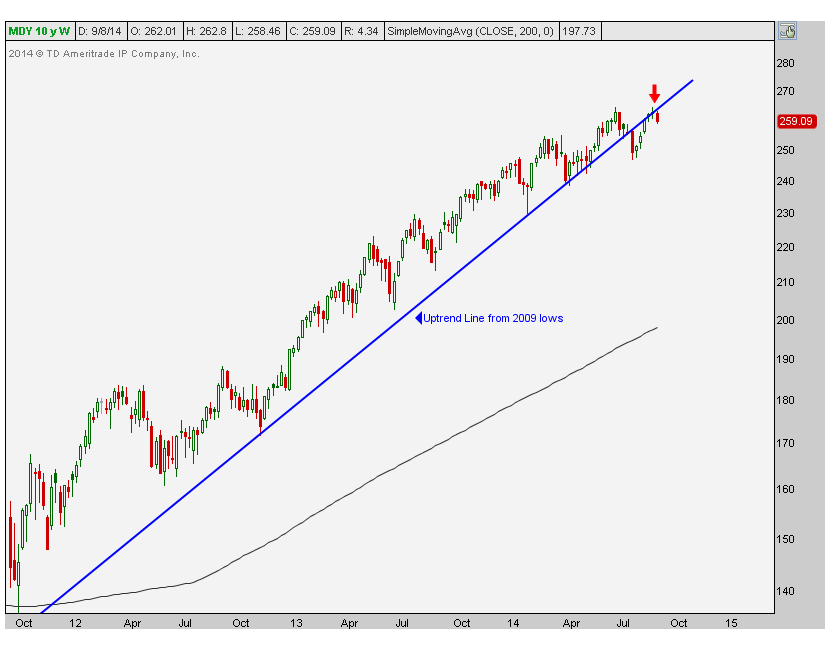 I would not want to own this as long as prices remain below that key uptrend line. At least not for now.
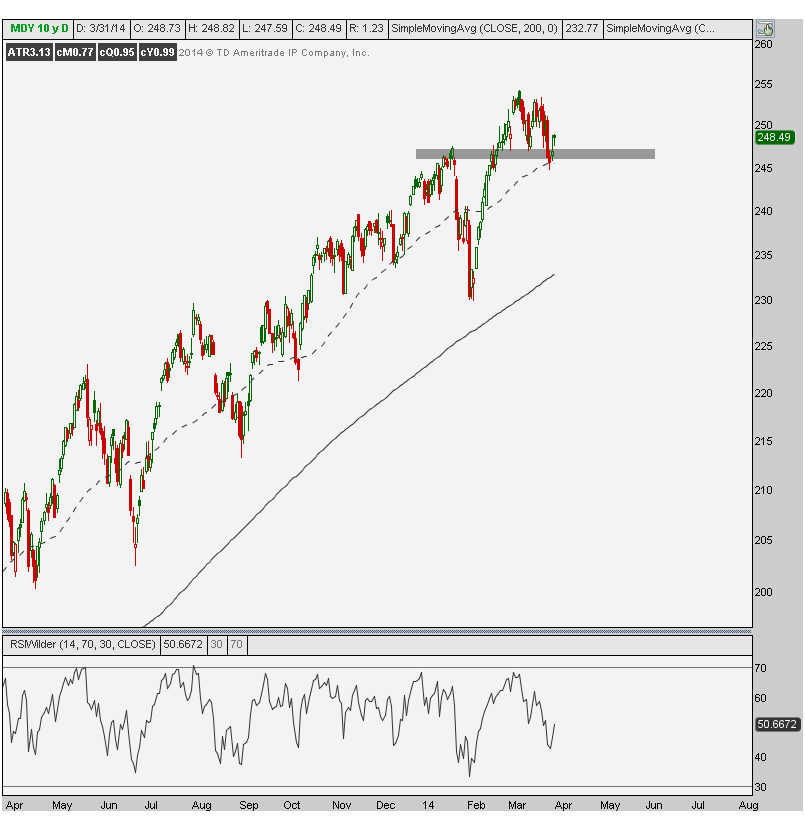
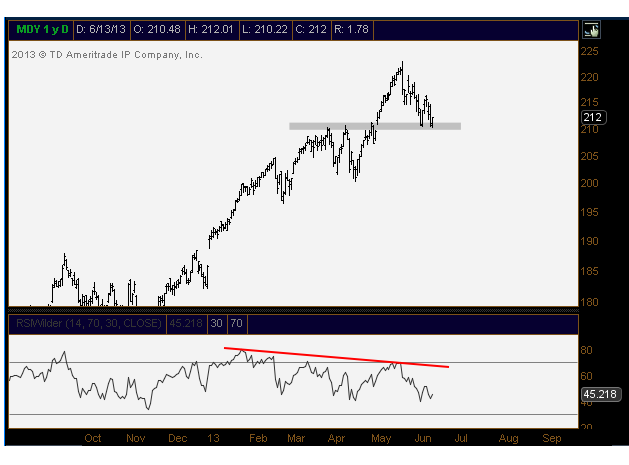
Next we are looking at a daily candlestick chart of $MDY with a 14-day relative strength index as a momentum reading. We can see that in early September Mid-Caps failed to exceed the July highs running into resistance and putting in what could potentially be a double top:
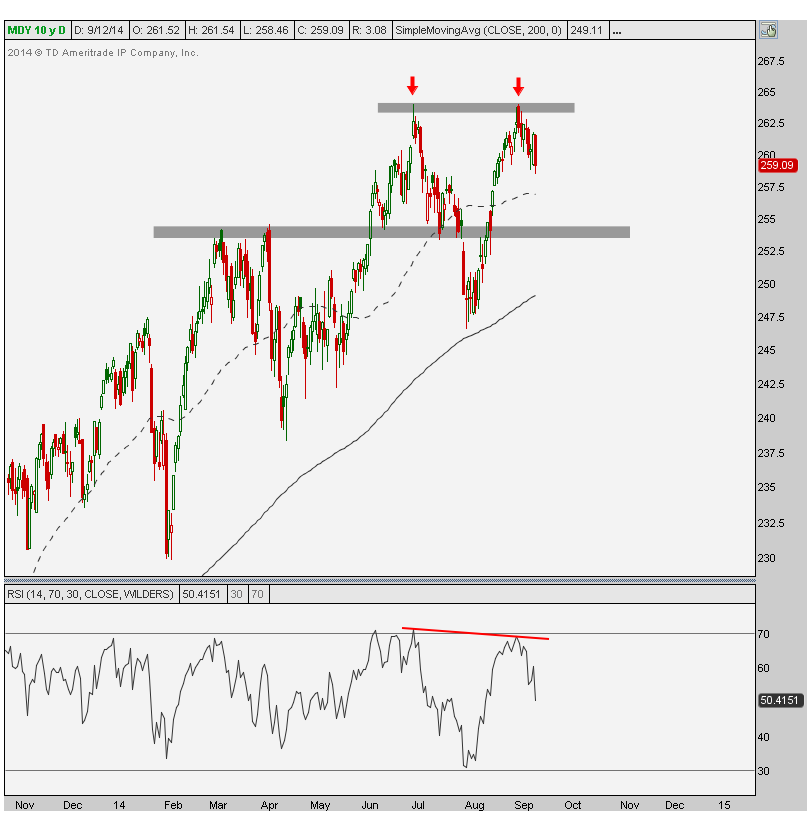
Another problem that I see here is that on this month’s highs, momentum put in a bearish divergence. This is not a good combination and suggests that the bears have the better risk/reward here. We would no longer want to be short above that 264 level that has been trouble over the last few months.
Over the short-term, that 254 level looks like it should serve as support. This level was resistance back in March and April, then turned into support during July. The bulls really need to step up and control that level, otherwise, things could get ugly.
A rising 200-day moving average also favors the bulls. It’s hard for markets to have steep corrections with upward sloping smoothing mechanisms like that. I would become much more neutral towards this market as we approach that moving average and support from August, then reevaluate the situation.
***
Members of Eagle Bay Solutions receive updates on these charts along with commentary each week. Our US Averages & Interest rates package includes all of the major US Index and Bond ETFs on multiple time frames, along with momentum analysis, sentiment, seasonality and pattern recognition.
Register here to become a member and start receiving our weekly updates.

Tags: $MDY $IWR $SCHM $JKG $IVOO $IJH