This is the video recording of the March 18th Town Hall Meeting w/ Willie Delwiche & JC Parets
03/18/21 2PM ET [Read more…]
Expert technical analysis of financial markets by JC Parets
This is the video recording of the March 18th Town Hall Meeting w/ Willie Delwiche & JC Parets
03/18/21 2PM ET [Read more…]
From the desk of Willie Delwiche.
Key takeaway: Investor optimism has been unwinding even as indexes have moved into record territory and breadth remains strong (NYSE new high list at its highest level since 2004). This week’s featured chart shows the spread between institutional and individual sentiment collapsing. This has tended to occur ahead of market strength, not weakness. While the risks from a strategic positioning perspective are undiminished (especially in the context of valuations and household equity exposure), the short-term and intermediate-term sentiment picture has improved in recent weeks as optimism has come off the boil. It looks to me like investor sentiment has moved off of the risk side of the scale and the weight of the evidence is turning more constructive not more cautious.
Sentiment Chart of the Week: Sentiment Spread, II less AAII
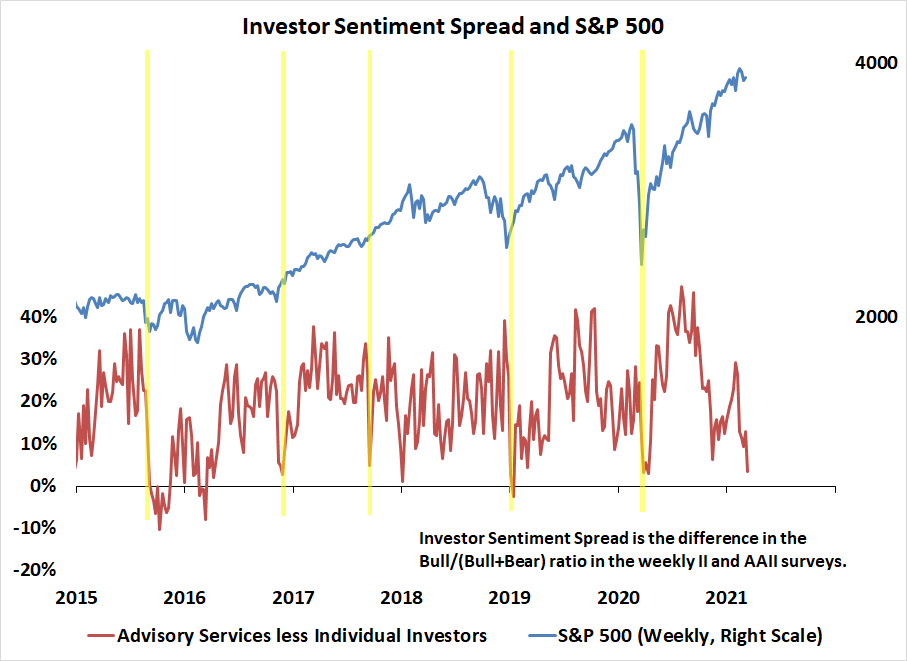
The current intensity of the advisory services move toward a cautious stance matched with a rise in individual investor optimism, implies a successful unwind of troublesome optimism that leads to better price action.
From the desk of Willie Delwiche.
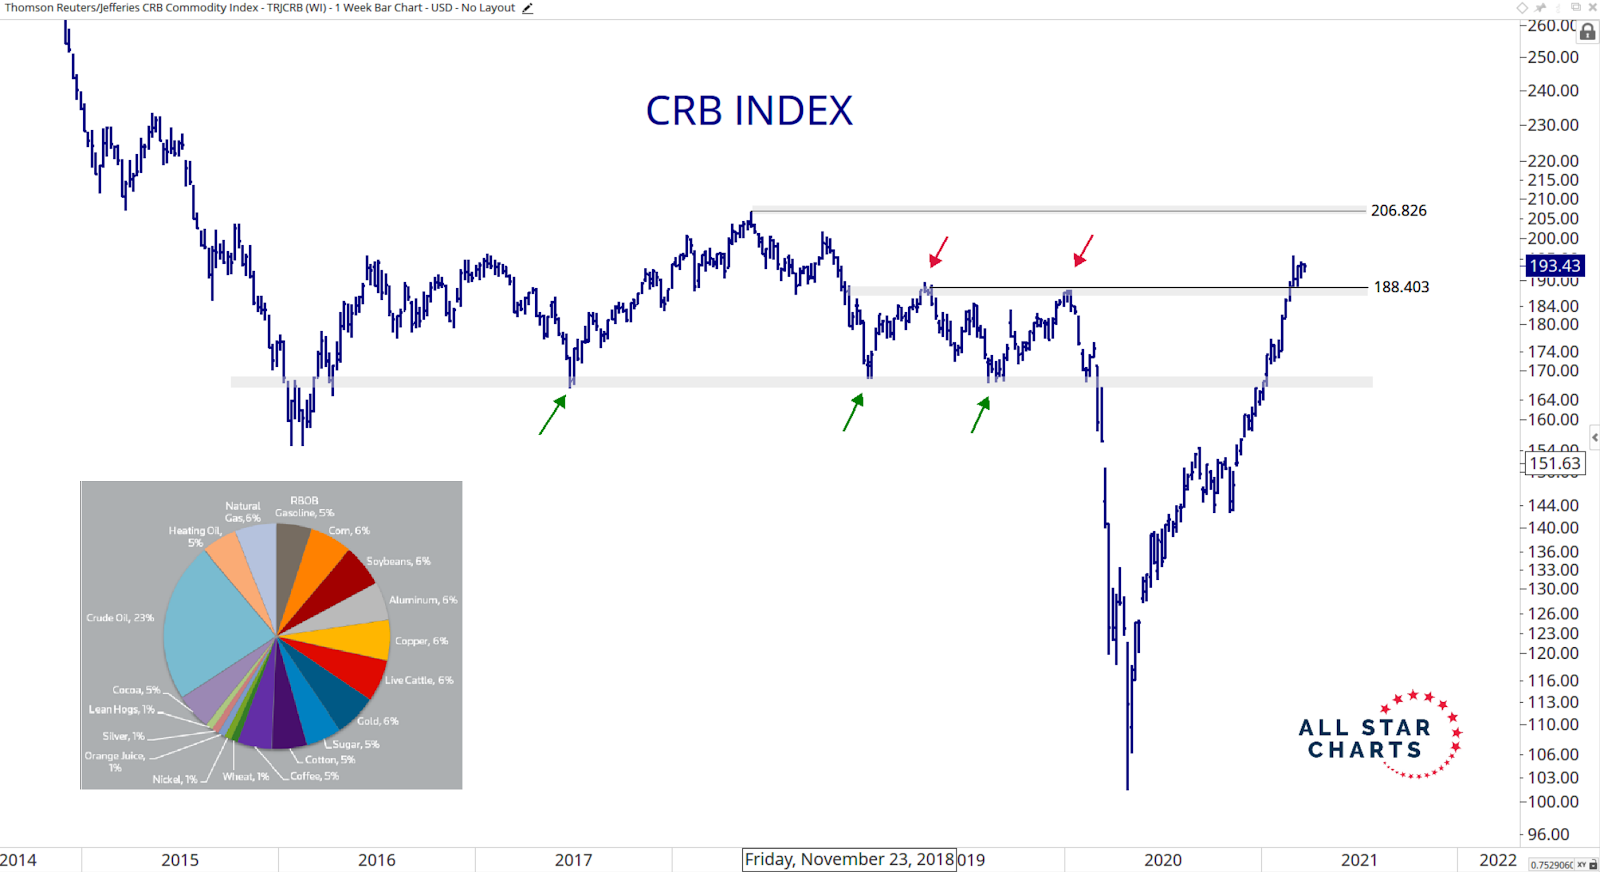
Key Takeaway: New high lists are expanding, yet investors are turning more cautious. Weight of the evidence favors focusing on opportunity over risk. Commodity market strength encouraging development for economy and investors. Rotation to cyclical leadership has just begun.
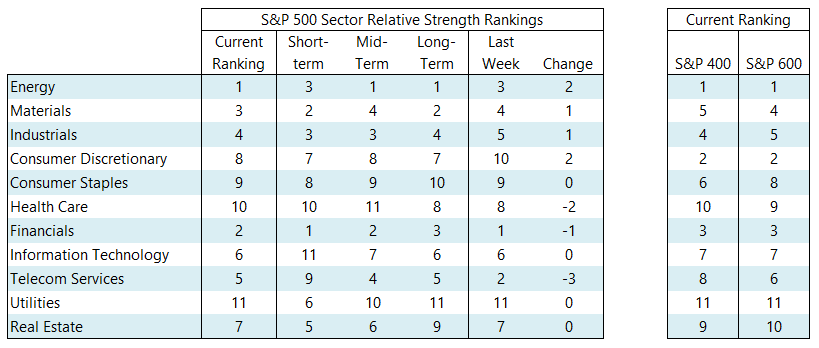
Energy has climbed to the top of our sector-level relative strength rankings, occupying the number one spot across all three capitalization levels. Energy hasn’t been at the top of the rankings since mid-2018. We are also seeing sector-level leadership (again across all capitalization levels) in Financials, Materials and Industrials. Previous leaders continue to drop in the rankings as “quality growth” has fallen out of favor. Stubborn investors are sitting on their hands, adaptive investors are listening to the market and following these new leadership trends. Industry group rankings show small-cap groups dominating the top of the rankings, and large cap groups dominating the bottom.
From the desk of Steve Strazza
Don’t miss this weeks Momentum Report; our weekly summation of all the major indexes at a Macro, International, Sector and Industry Group level. As a reminder, we analyze this shorter-term data within the context of the structural trends at play.
From the desk of Willie Delwiche.
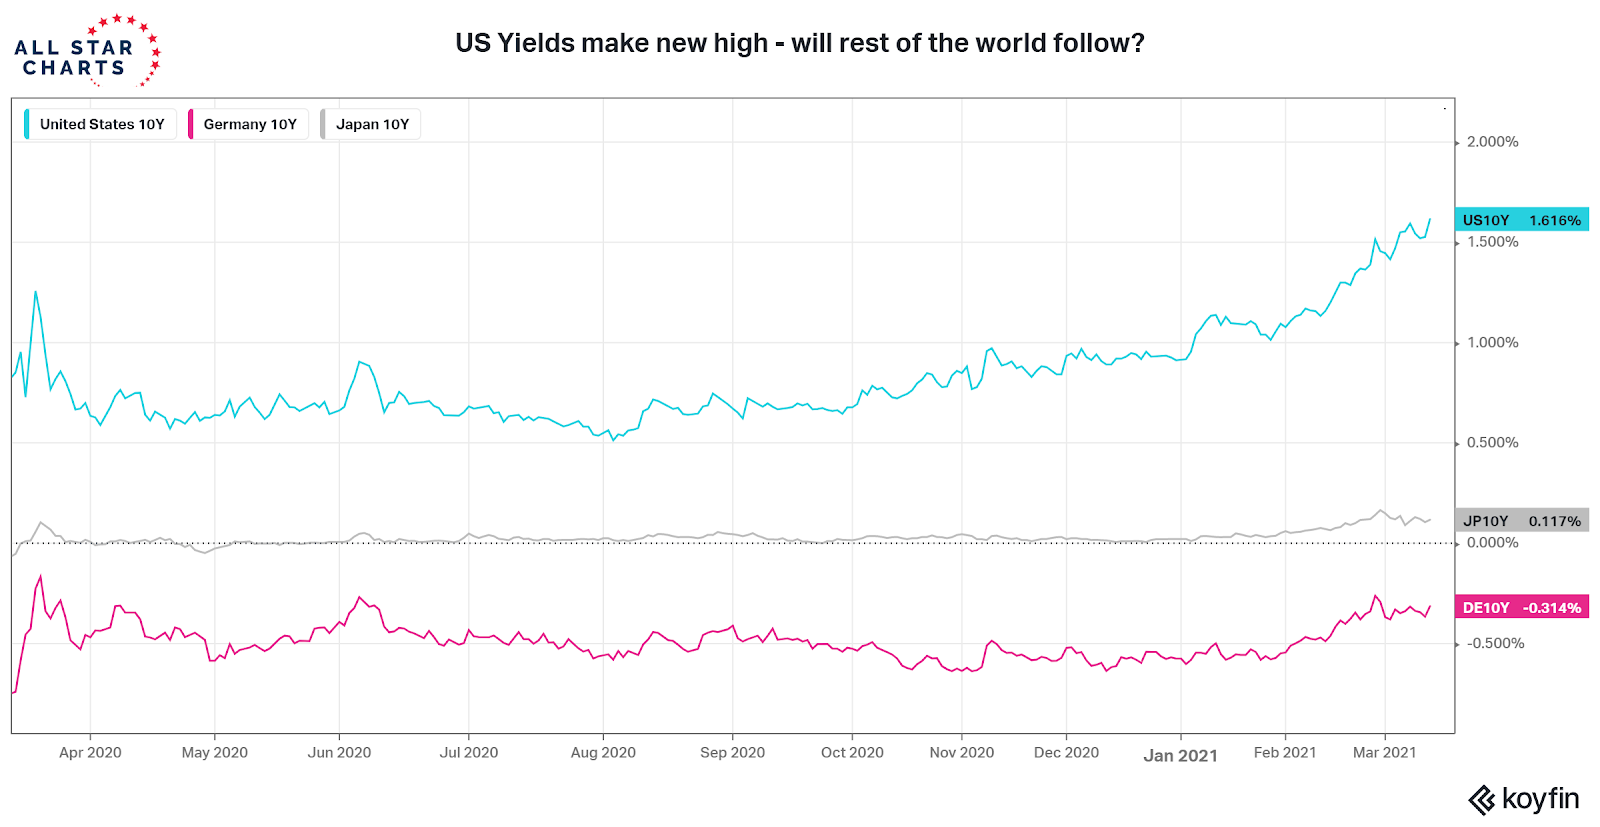
Treasury yields have resumed their upward ascent and the 10-year T-Note yield appears poised to move toward 2.0%. I saw a study this week from Joe Kalish of NDR that suggested such a move would put further downward pressure on the NASDAQ 100 (to the tune of a 20% peak-to-trough decline). Joe’s analysis tends to be pretty astute, so it’s something to think about even if you don’t come to the same conclusion. Another thing to keep an eye on: if these new highs in Treasury yields are going to be sustained, the yields around the world are likely going to echo the move in the US. Right now, yields in both Germany and Japan are shy of their late-February peaks (0.17% for the JGB and -0.26% for the Bund).
From the desk of Steve Strazza @Sstrazza
1. Dow Averages Take The Driver Seat
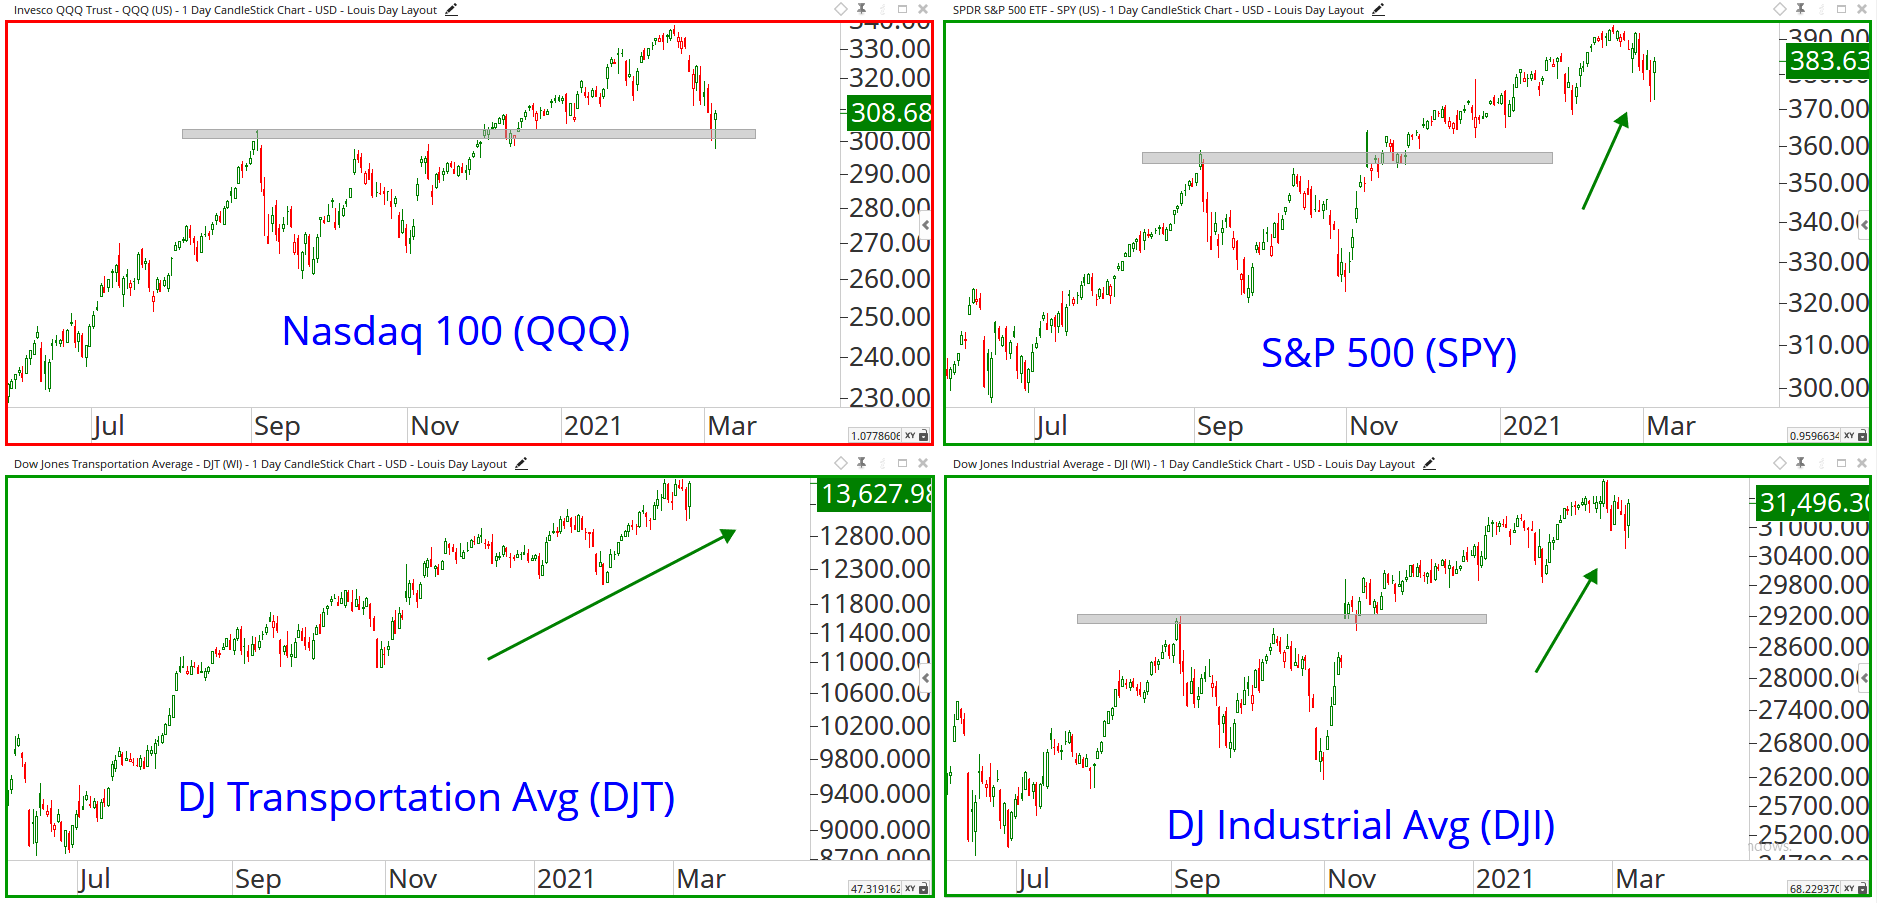
At the index level, the Large-Cap Growth-heavy Nasdaq has felt the burden of the last month’s selling pressure. In fact, all other major indices in the US have generated positive returns over the last month. The Nasdaq is the one negative standout. It’s not that we’re seeing money flow out of stocks. Instead, we’re seeing money rotate between stocks.
We shared this chart and observation in our RPP Report earlier this week. Dow Transports and Dow Industrials were barely impacted by the recent volatility, and both have gone on to make new all-time highs since. This has everything to do with the composition of these indexes. The Dow Industrial Average has a lot more Financials compared to the Nasdaq, and half the exposure to Technology. Transports are an even more extreme example, as they have zero exposure to Technology.
This disparity among the major indexes all comes down to the sector rotation that’s taking place. Until we start to see breakdowns on an absolute basis, this is not a cause for concern. As we’ll discuss below, we’re seeing the exact opposite this week as buyers dig in and defend key levels in the Nasdaq and other indexes.
This is the video recording of the March 11th Town Hall Meeting w/ Willie Delwiche & Steve Strazza
03/11/21 2PM ET [Read more…]