Price.
Expert technical analysis of financial markets by JC Parets
In this week’s members-only letter we discuss the following topics:
In every market there are leaders and there are laggards. This is the case in both bull and bear markets. Regardless of the environment, some stocks and sectors will simply outperform others. Sometimes, this relative performance tells us a lot about the overall risk-appetite for institutional investors and in which direction they are headed.
Today’s Chart Of The Week [Read more…]
In honor of Superbowl 50, we created a countdown of what we consider to be the most important 50 charts in the world. These include U.S. Stocks and Sectors, International Indexes, Currencies, Commodities, Interest Rate Markets and Global Intermarket relationships. Some of these are more actionable than others, but collectively I think they truly tell the story of global market risk, or risk aversion for that matter.
Members of All Star Charts get access to all of this information 24/7, so we would like to invite you to start a 30-Day Risk Free Trial and Join us to see if our community is right for you. We have received incredible feedback from our members and will continue to improve the platform.
Discount Offer & Risk Free Trial: https://jc-parets-rmds.vprod05.rmkr.net/superbowl/
Here is the video in full (audio begins immediately, video gets going after 30 seconds)…..Enjoy! [Read more…]
Every month we host a conference call for All Star Charts Members where we discuss ongoing themes throughout the global marketplace as well as changes in trends where new positions would be most appropriate. This includes U.S. Stocks & Sectors, International Stock Indexes, Commodities, Currencies and Interest Rate Markets.
This month’s Conference Call will be held Thursday February 11, 2016 at 7PM ET
In this month’s premium members conference call, we will discuss the following topics: [Read more…]
One of the most valuable tools that we have as market participants is in taking the sum of the parts to help come up with a final conclusion. While we all talk about what the Dow did yesterday or what it’s done year-to-date, it is easy to forget that there are 30 companies driving this popular U.S. stock market benchmark. By going through each of these 30 stocks, we can get a better feel for the market itself rather than just analyzing the performance of the index. To me, it’s the combination of the two that seems to be the best approach.
All of the 30 Dow Components have just been updated in the Chartbook, and here are my notes on the results: [Read more…]
From the desk of Thomas Bruni @brunicharting
***
As momentum stocks breakdown, the Nasdaq 100 has begun to breakdown in a similar fashion on a relative basis.
Below is a daily chart of the Nasdaq 100 vs the S&P 500.
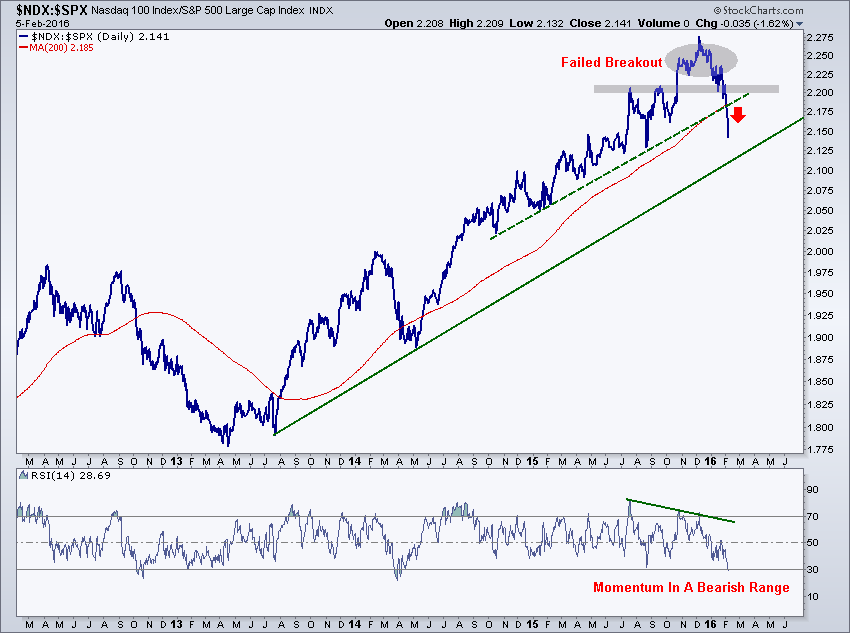 This ratio broke out to new highs late last year and spent a few months consolidating before ultimately resolving to the downside. This violent resolution lower confirmed a failed breakout as well as a bearish momentum divergence. Prices have since broken through the uptrend line from the summer of 2014 and look to be heading for a test of the uptrend from the June 2013 lows. From failed moves come fast moves, so I wouldn’t be surprised if this ratio ultimately retests the breakout level near 2.0 which corresponds with the 61.8% retracement of the 2013-2016 rally.
Within this theme, Electronic Arts is one individual component that looks particularly vulnerable to the meltdown taking place in Nasdaq 100 stocks and momentum names as a whole.
In honor of Superbowl 50 I share with you what I think are the best 50 charts in the world. The hashtag on Twitter to follow along is #SB50Charts. Here is the entire list in order. Click the link inside the tweets for comments on each chart. [Read more…]


