From the desk of Willie Delwiche.
Expert technical analysis of financial markets by JC Parets
On both an absolute and a relative basis, healthcare names continue to perform. I guess the need for quality healthcare is a stronger driver of stock prices than interest rates and global macro? At least for now, that appears to be the case.
One name we’ve been watching, Cigna $CI, is knocking on the door of a major base breakout.
[Read more…]
This is the video recording of our July 2nd Monthly Charts Live Strategy Session
Key Takeaway:
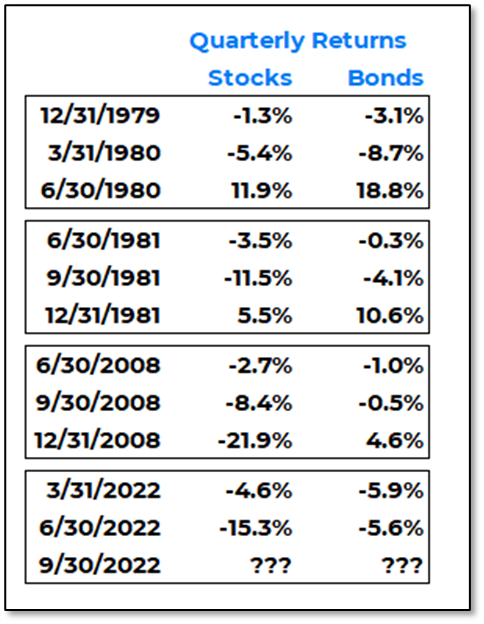
The first half of 2022 was one for the record books, but it was more dubious than distinguished. Only two years (2020 & 2009) in the past quarter century experienced more 1% moves in the first half than did 2022 and only one (2008) finished the year with a higher percentage of 1% moves than we have experienced in the first half of this year. Both stocks and bonds were down in back-to-back quarters for only the third time in the past 45 years. This contributed to the benchmark 60/40 stock/bond portfolio experiencing a first half of the year that was twice as bad as another in the past quarter century. According to data from Ned Davis Research, it was the worst first half for a balanced portfolio since the 1930’s.
There are plenty of observations about how the worst first halves are followed by strength in the second half and ample evidence that stocks tend to bottom prior to mid-term elections and then rally in their wake. Looking back through history, we anchor to the darkest days and see the daylight that follows. It is certainly true that sometimes bad periods have been followed by better periods, but other times they have been followed by worse periods. When both stocks and bonds have been down two quarters in a row in the past, the S&P 500 was all over the place in the quarter that followed: +12% in Q2 1980, +6% in Q4 1981, -22% in Q4 2008.
Because it’s been bad doesn’t mean it’s about to get good. Because the market has survived these periods of turmoil does not mean that investors have emerged unscathed, either financially or emotionally.
From the desk of Steve Strazza @sstrazza
This is one of our favorite bottom-up scans: Follow the Flow. In this note, we simply create a universe of stocks that experienced the most unusual options activity — either bullish or bearish, but not both.
We utilize options experts, both internally and through our partnership with The TradeXchange. Then, we dig through the level 2 details and do all the work upfront for our clients.
Our goal is to isolate only those options market splashes that represent levered and high-conviction, directional bets.
 We also weed out hedging activity and ensure there are no offsetting trades that either neutralize or cap the risk on these unusual options trades.
What remains is a list of stocks that large financial institutions are putting big money behind.
And they’re doing so for one reason only: because they think the stock is about to move in their direction and make them a pretty penny.
Then we flip through our list of stocks flashing unusual activity and pick the best setups using many of the same technical filters we do for our other scans.
And, just like that, we’ll follow the money flow and fatten our own pockets along with some of the world’s most powerful financial institutions.
From the desk of Steve Strazza @Sstrazza
Welcome to our latest Minor Leaguers report.
We’ve had some great trades come out of this small-cap-focused column since we launched it back in 2020 and started rotating it with our flagship bottom-up scan, Under the Hood.
For the first year or so, we focused only on Russell 2000 stocks with a market cap between $1 and $2B.
That was fun, but we wanted to branch out a bit and allow some new stocks to find their way onto our list.
We expanded our universe to include some mid-caps.
To make the cut for our Minor Leaguers list, a company must have a market cap between $1 and $4B.
And it doesn’t have to be a Russell component — it can be any US-listed equity. With participation expanding around the globe, we want all those ADRs in our universe.
The same price and liquidity filters are applied. Then, as always, we sort by proximity to new highs in order to focus on the best players.
But, instead of all-time highs, we’re sorting by 52-week highs these days, as we don’t want to discriminate against energy or other cyclical stocks.
The goal is still to catch the strongest names while they’re small and have serious upside potential. If any of these stocks ever climb the ranks to the big leagues, the returns could be huge.
We’re looking at up to 10x moves just to break into large-cap land!
Let’s dive into this week’s report and see what’s happening in some of the hottest stocks in the Minor Leagues.
From the desk of Steve Strazza @Sstrazza
Check out this week’s Momentum Report, our weekly summation of all the major indexes at a Macro, International, Sector, and Industry Group level.
By analyzing the short-term data in these reports, we get a more tactical view of the current state of markets. This information then helps us put near-term developments into the big picture context and provides insights regarding the structural trends at play.
Let’s jump right into it with some of the major takeaways from this week’s report:
* ASC Plus Members can access the Momentum Report by clicking the link at the bottom of this post.


