This is the weekly post that aggregates all the charts we put together throughout the week and organizes them all into one, easy to flip through deck.
Expert technical analysis of financial markets by JC Parets
This is the weekly post that aggregates all the charts we put together throughout the week and organizes them all into one, easy to flip through deck.
Dr. Copper is in the hot seat again this week!
I know we just covered copper and the copper/gold ratio. But this is a major development, so let’s dive in a little deeper.
When one of the most important procyclical assets breaks to fresh 52-week lows, it takes center stage. It also has major implications across a variety of markets.
But what about energy? What about grains and softs and the rest of the commodity space?
Well, most of those contracts have already been in correction mode.
And, based on the recent selloff in energy and other commodity-related stocks, a much deeper correction could be in store for these raw materials.
It’s definitely something we’re monitoring. And that’s where copper and today’s chart in focus come into play.
Let’s take a look. [Read more…]
From the desk of Steve Strazza @Sstrazza
Our International Hall of Famers list is composed of the 100 largest US-listed international stocks, or ADRs. We’ve also sprinkled in some of the largest ADRs from countries that did not make the market-cap cut.
These stocks range from some well-known mega-cap multinationals such as Toyota Motor and Royal Dutch Shell to some large-cap global disruptors such as Sea Ltd and Shopify.
It’s got all the big names and more–but only those that are based outside the US. You can find all the largest US stocks on our original Hall of Famers list.
The beauty of these scans is really in their simplicity.
We take the largest names each week and then apply technical filters in a way that the strongest stocks with the most momentum rise to the top.
Based on the market environment, we can also flip the scan on its head and filter for weakness.
Let’s dive in and take a look at some of the most important stocks from around the world.
From the desk of Willie Delwiche.
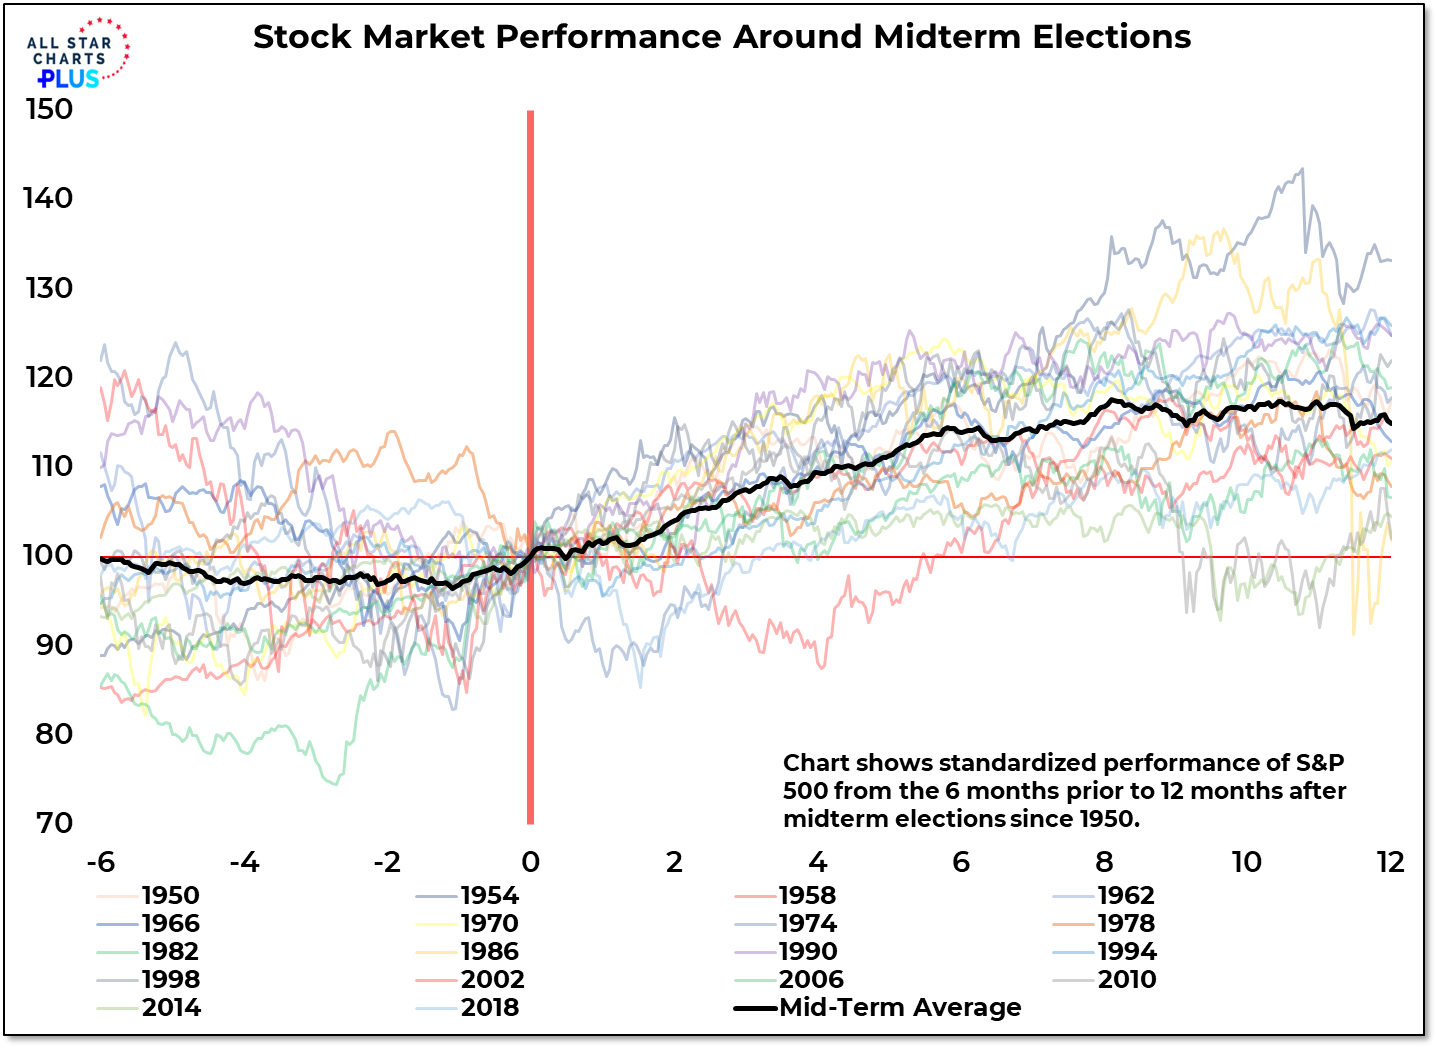
This is a good time to think about what could happen after the midterms because the run-up to this fall’s elections could be almost unbearable. The Fed, the Supreme Court and lingering fights over the 2020 election will provide candidates of all stripes with plenty of political fodder. The public mood is already dour and an onslaught of negative ads is not likely to help. History and conventional wisdom suggest stocks could struggle for traction over the summer, find a low prior to the election and then rally as the outcome becomes evident. The S&P 500 has been higher 12 months after every single mid-term election since at least 1950. The problem with that information is that it is being widely discussed. The data is what it is and the past is all we have to go on. Nonetheless, the words of Bernard Baruch seem relevant right now: “Something that everyone knows isn’t worth anything.”
An alternative view is that the pattern of the S&P 500 since its early year peak is not dissimilar to what was seen after its October 2007. If that period is a roadmap for now (and there are enough similarities for me to not immediately discount the possibility) the S&P 500 could rally off and on into mid August before resuming its downtrend as we move to and through the midterm elections. That pattern would catch many off guard. It’s up to the bulls to prove that it is not a likely path.
From the desk of Steven Strazza @Sstrazza and Ian Culley @Ianculley
Bonds are off to their worst start in the past 40 years, possibly ever!
It’s not even close.
As we near the end of Q2, the US Treasury Bond ETF $TLT is down almost 22% year to date. And that’s after its recent bounce higher.
There’s been nowhere to hide, as these traditional safe-haven assets have been an absolute dumpster fire along with stocks.
But we’re starting to see some of those flames extinguished.
Some of the worst-performing stocks tipped the bond market’s hand ahead of the recent lows. That’s right: Those Big Tech names and Chinese internet stocks stopped going down months ago and now bonds are following higher.
Believe it or not, bonds and high-duration equities have a lot in common. The Growth $IWF versus Value $IWD ratio really tells the story.
Let’s take a look.
This is the video recording of the June 23rd Weekly Town Hall w/ Willie Delwiche.
06/23/22 2:00 PM ET [Read more…]
From the desk of Willie Delwiche.
Monday was an unexpected break. Markets were closed for Juneteenth Day, which is now a Federal holiday. I didn’t realize that would be the case until the middle of last week. It has made for a short week in the market after a long weekend for doing whatever it is you do to get refreshed after staring at computer screens all day. For me, it meant more time in the garden.
The garden has provided its own share of unexpected developments recently, and I’m not just talking about volunteer cantaloupes (though there are several of them around).
In the pond, a spike in ammonia levels necessitated an overdue and unexpectedly extensive cleaning. Not only is it now a healthier environment in which the fish can thrive, but in the process we discovered a baby fish that we hadn’t known about.
Monday night we held our June Monthly Conference Call, which Premium Members can access and rewatch here.
In this post, we’ll do our best to summarize it by highlighting five of the most important charts and/or themes we covered, along with commentary on each.
Let’s get right into it!


