This is the weekly post that aggregates all the charts we put together throughout the week and organizes them all into one, easy to flip through deck.

Expert technical analysis of financial markets by JC Parets
This is the weekly post that aggregates all the charts we put together throughout the week and organizes them all into one, easy to flip through deck.
With Cryptos finally waking up a bit this week, we’re seeing new flowers popping in our gardens.
There are some familiar names ripping like Terra $LUNA, Avalanche $AVAX and Near Protocol $NEAR, but there are also some new ones than some of you might not be familiar with.
Today I want to talk about the Oasis Network $ROSE.
When looking at the chart, it looks a lot like many others out there. This is another one of those, “We only want to be long if we’re above the first half highs”, type coins. [Read more…]
From the desk of Steven Strazza @Sstrazza and Ian Culley @Ianculley
As we approach year-end, we’re diving into the individual commodity groups to gauge the status of the primary trends and to get a better idea of where we’re likely headed in 2022.
Last week, we highlighted precious metals — by far the worst performers of 2021 with a -10.59% return thus far. We think there’s a good chance they’ll turn things around next year and start participating.
Today, we’re going to review the other end of the spectrum in terms of performance — energy!
While base metals and ags have posted strong gains over the trailing 12-months — 25.96% and 28.22% respectively — energy has been the real leader, quietly printing a 46.33% gain despite recent selling pressure.
After crude oil collapsed below zero last year, the entire group had its work cut out. But they’ve covered an amazing amount of ground in a short period of time, and we think they have further to go.
Let’s take a look at what’s happening in this leadership group and how we want to position ourselves as we head into the new year.
From the desk of Steve Strazza @Sstrazza
Our International Hall of Famers list is composed of the 50 largest US-listed international stocks, or ADRs. We’ve also sprinkled in some of the largest ADRs from countries that did not make the market-cap cut.
These stocks range from some well-known mega-cap multinationals such as Toyota Motor and Royal Dutch Shell to some large-cap global disruptors such as Sea Ltd and Shopify.
It’s got all the big names and more — but only those that are based outside the US. You can find all the largest US stocks on our original Hall of Famers list.
The beauty of these scans is really in their simplicity.
We take the 50 largest names each week and then apply technical filters in a way that the strongest stocks with the most momentum rise to the top.
Based on the market environment, we can also flip the scan on its head and filter for weakness.
Let’s dive in and take a look at some of the most important stocks from around the world.
From the desk of Steven Strazza @Sstrazza and Ian Culley @IanCulley
Our focus has been on US Treasury yields in recent months – and for good reason.
The 30-year yield recently undercut its summer lows, and the 10-year yield briefly lost the critical 1.40 level. Both have since recovered. But these crucial rates remain stuck in the same messy ranges that have defined most of 2021.
Given the lack of decisive action in domestic yields, we think it’s a good time to check in on the overseas bond markets in hopes of gleaning some insight into the potential direction of yields outside the US.
In today’s post, we’re going to switch things up and take a look at the 10-year yields from other major developed countries.
This is the video recording of the December 22nd Weekly Town Hall w/ Willie Delwiche
12/22/21 2:00 PM ET [Read more…]
From the desk of Willie Delwiche.
Key Takeaway: The sentiment backdrop is more characterized by a lack of optimism than widespread pessimism. This is in sharp contrast to the experiences of December 2020 and 2019. In those instances, too much holiday cheer led to hangovers in the year that followed (don’t forget, new highs peaked early in 2021 and many areas have been a sideways mess for months now). The current sentiment backdrop is not dissimilar to (though less extreme than) what was experienced in December 2018. Intense selling that month had investors thinking more about the Grinch than Santa Claus. While probably won’t get widespread pessimism this time around without further volatility – but if we do and investors throw in the towel on stocks, it could ultimately help light a fire that leads to early year breadth thrusts like what we experienced in early 2019.
Sentiment Report Chart of the Week: Households Are Loaded Up On Equities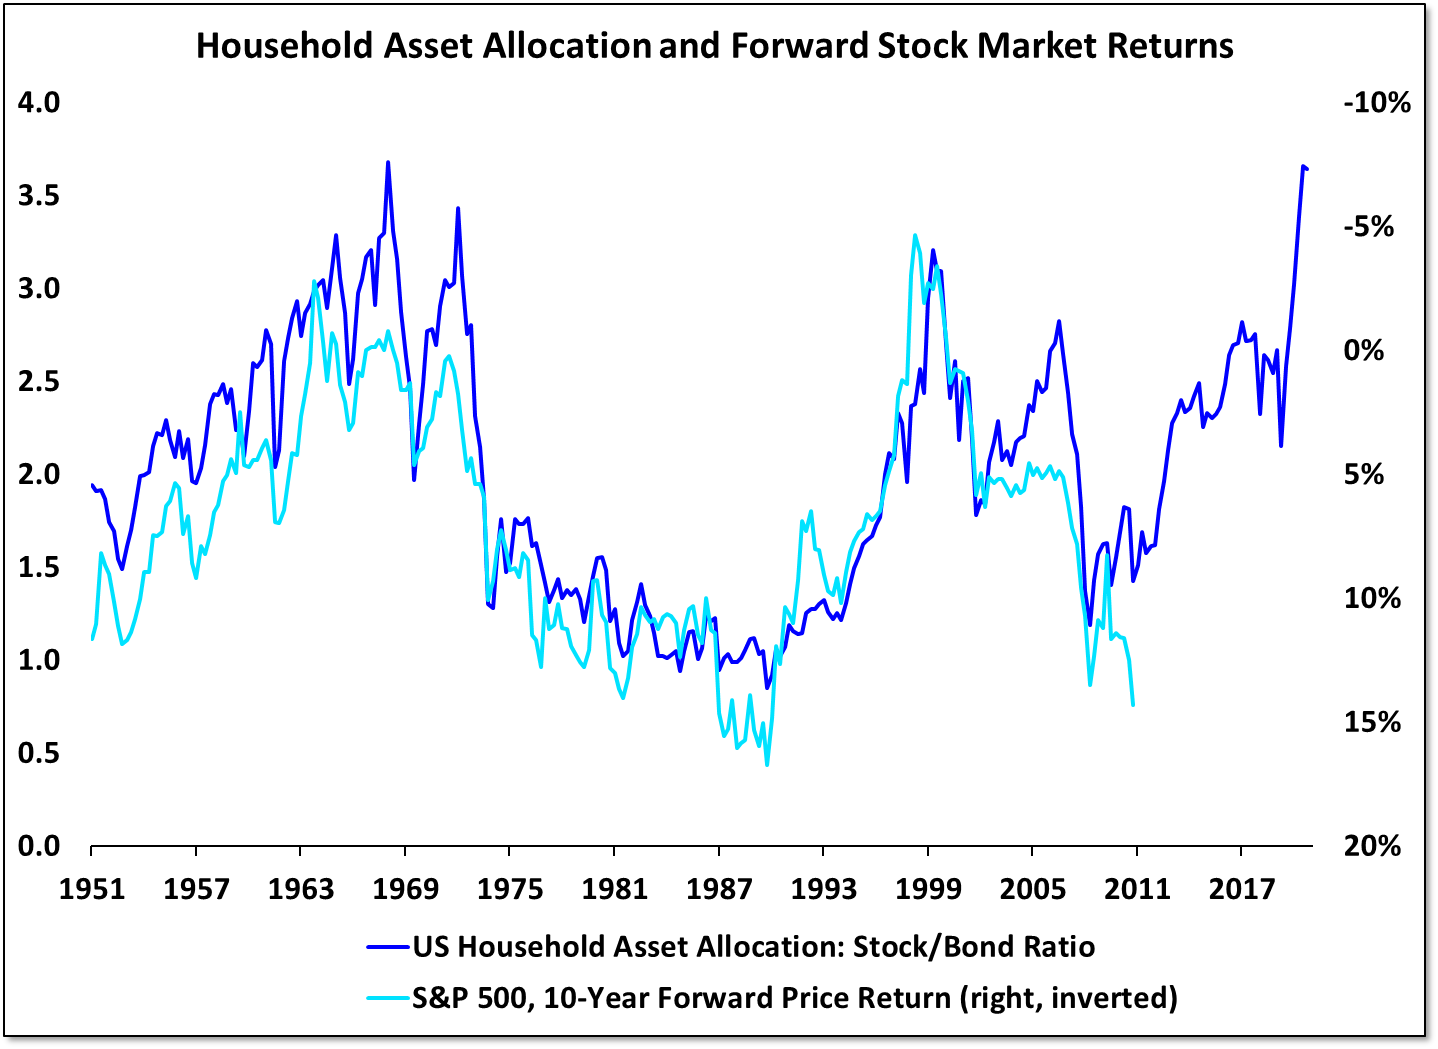
Quarterly data from the Federal Reserve shows that asset allocation at the household level shows a historically high tilt toward equities and away from bonds. There are certainly quarter-to-quarter variations, but the inverse relationship between the stock/bond ratio and forward returns for the S&P 500 is, over time, about as tight as they come. Households loading up on stocks (in terms of flows and overall levels) tends to be a headwind for returns.
What a difference a few days makes, eh?
On Monday morning, if you were on twitter or watching the teevee you’d have assumed the stock market was about to get cut in half and the pitchforks were going to be lining up outside the Federal Reserve building in Washington, D.C.
Then, the market did what the market does and now here we are with the S&P 500 looking like it wants to make another run at all-time highs.
Forget about market volatility — how about trader’s emotional volatility?!
With this in mind, there is still some nice options premium being priced into individual names that offer us some unique tactical opportunities for some quick gains. [Read more…]


