Join Sean and JC on Tuesday December 28th at 4:30 PM EST for our Options Holiday Party Livestream!
Don’t miss this quick video below where Sean previews the event.
Expert technical analysis of financial markets by JC Parets
Join Sean and JC on Tuesday December 28th at 4:30 PM EST for our Options Holiday Party Livestream!
Don’t miss this quick video below where Sean previews the event.
From the desk of Steven Strazza @Sstrazza and Ian Culley @IanCulley
Major world currencies continue to struggle against the US dollar.
Both the euro and British pound have been coiling near 52-week lows against the dollar. We’re also seeing weakness spread among commodity-centric currencies, as the Canadian dollar hit new 52-week lows this week, and the Australian dollar accomplished the same earlier in the month. As for the safe-haven Japanese yen, USD/JPY hit its highest level since 2017 at the end of November.
The bottom line is that we continue to see broad strength from the greenback.
Meanwhile, the US Dollar Index $DXY continues to consolidate within a tight continuation pattern.
As we wait for a resolution either higher or lower, we can look to these individual forex pairs for an indication of which direction we’re likely headed.
Let’s revisit the potential failed breakdown from the Australian dollar earlier in the month and the recent action in the Canadian dollar for clues.
Key Takeaways:
There was a story in the WSJ earlier this year about a fund manager who held 900 of his best ideas in his main mutual fund. I saw a model this summer that was made up of nearly 100 individual momentum indicators. Some will use a double-digit number of categories for gauging the market. One more holding, one more indicator, one more lever – it’s as easy as adding one more column in the spreadsheet. If more is better that is great, the question though is at what point is more just too much.
Information, even when useful, can easily pile up and become overwhelming. This adds to, rather than reduces noise. Distillation is an ongoing challenge in this age of distraction. There is a tension between focusing on as much as we need to, but as little as we have to. This can matter to investors facing the prospect of wading through 2022 outlook pieces filled with forecasts, expectations and a myriad of moving parts. I’d rather focus on just a few (less than a handful) of indicators for identifying risk and opportunity next year. I expect they will matter in 2022 because they have mattered most of the time in recent years.
From the desk of Steve Strazza @sstrazza
This is one of our favorite bottom-up scans: Follow the Flow. In this note, we simply create a universe of stocks that experienced the most unusual options activity — either bullish or bearish… but NOT both.
We utilize options experts, both internally and through our partnership with The TradeXchange. Then, we dig through the level 2 details and do all the work upfront for our clients. Our goal is to isolate only those options market splashes that represent levered and high-conviction, directional bets.
 We also weed out hedging activity and ensure there are no offsetting trades that either neutralize or cap the risk on these unusual options trades.
What remains is a list of stocks that large financial institutions are putting big money behind… and they’re doing so for one reason only: because they think the stock is about to move in their direction and make them a pretty penny.
Then we flip through our list of stocks flashing unusual activity and pick the best setups using many of the same technical filters we do for our other scans. And just like that, we’ll follow the money flow and fatten our own pockets along with some of the world’s most powerful financial institutions.
From the desk of Steve Strazza @Sstrazza
Welcome to our latest Minor Leaguers report.
We’ve already had some great trades come out of this small-cap-focused column since we launched it late last year and started rotating it with our flagship bottom-up scan, Under the Hood.
We recently decided to expand our universe to include some mid-caps…
For about a year now, we’ve focused only on Russell 2000 stocks with a market cap between $1 and $2B. That was fun, but it’s time we branch out a bit and allow some new stocks to find their way onto our list.
The way we’re doing this is simple…
To make the cut for our new Minor Leaguers list, a company must have a market cap between $1 and $4B. And it doesn’t have to be a Russell component–it can be any US-listed equity. With participation expanding around the globe, we want all those ADRs in our universe.
The same price and liquidity filters are applied. Then, as always, we sort by proximity to new highs in order to focus on the best players. But instead of all-time highs, we’re sorting by 52-week highs these days as we don’t want to discriminate against energy or other cyclical stocks.
The goal is still to catch the strongest names while they’re small and have serious upside potential. If any of these stocks ever climb the ranks to the big leagues, the returns could be huge. We’re looking at up to 10x moves just to break into large-cap land!
Let’s dive into this week’s report and see what’s happening in some of the hottest stocks in the Minor Leagues.
From the desk of Willie Delwiche.
From the desk of Steve Strazza @Sstrazza
Our Top 10 Charts Report was just published.
In this weekly note, we highlight 10 of the most important charts or themes we’re currently seeing in asset classes around the world.
Are The Worst Stocks Bottoming?
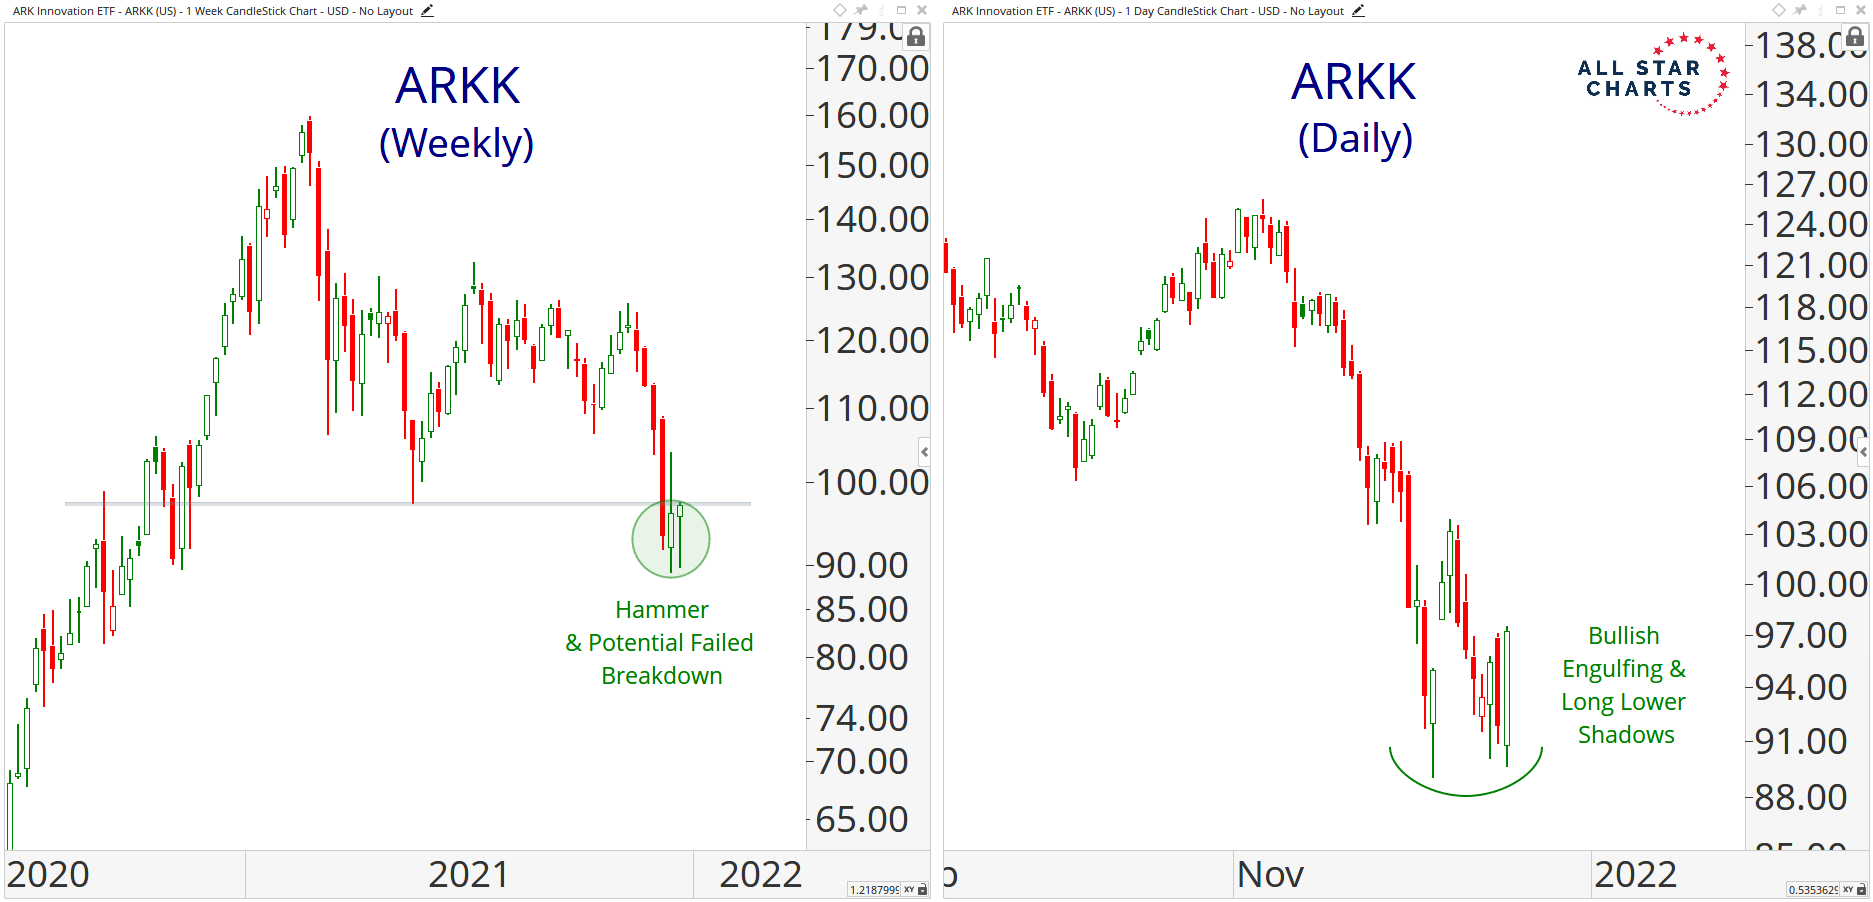
One thing we’re looking for to signal that the selling pressure has passed is the weakest areas carving out bottoms. In recent sessions, we’ve actually seen resilience and some relative strength from US growth stocks. Many of 2020s top-performers have endured significant losses already this year, and the ARK Innovation ETF is a great barometer for what’s taken place. When we look at a weekly chart, there is a hammer candle slightly beneath the May lows. If we see some upside follow-through, this could result in a failed downside move and fast move in the opposite direction. We’re also seeing signs of selling pressure waning on the daily chart as buyers continue to step in during the intraday session and send prices higher. This is illustrated by a handful of long lower wicks at the recent lows, which is evidence of strong demand at current levels. We think things are setting up for these laggards to put in a tradable low. If the worst stocks can bottom and reverse higher, what are the strongest stocks likely doing? We think they’ll be back at new highs in no time if this is the case.